Overview
Today, I would like to share what I did this year at Nuxeo. Nuxeo is a content management platform to build modern business applications. I work at Nuxeo Online Services (NOS) Team, a SaaS (software as a service) application including all online services of Nuxeo: Nuxeo Studio, Nuxeo Marketplace, Nuxeo Connect Dashboard, Nuxeo Register, and command-line tool “nuxeoctl”. In the following paragraphs, I will explain my daily mission as a Software Engineer through 8 parts: plan, code, test, build, release, deploy, operate and monitor.
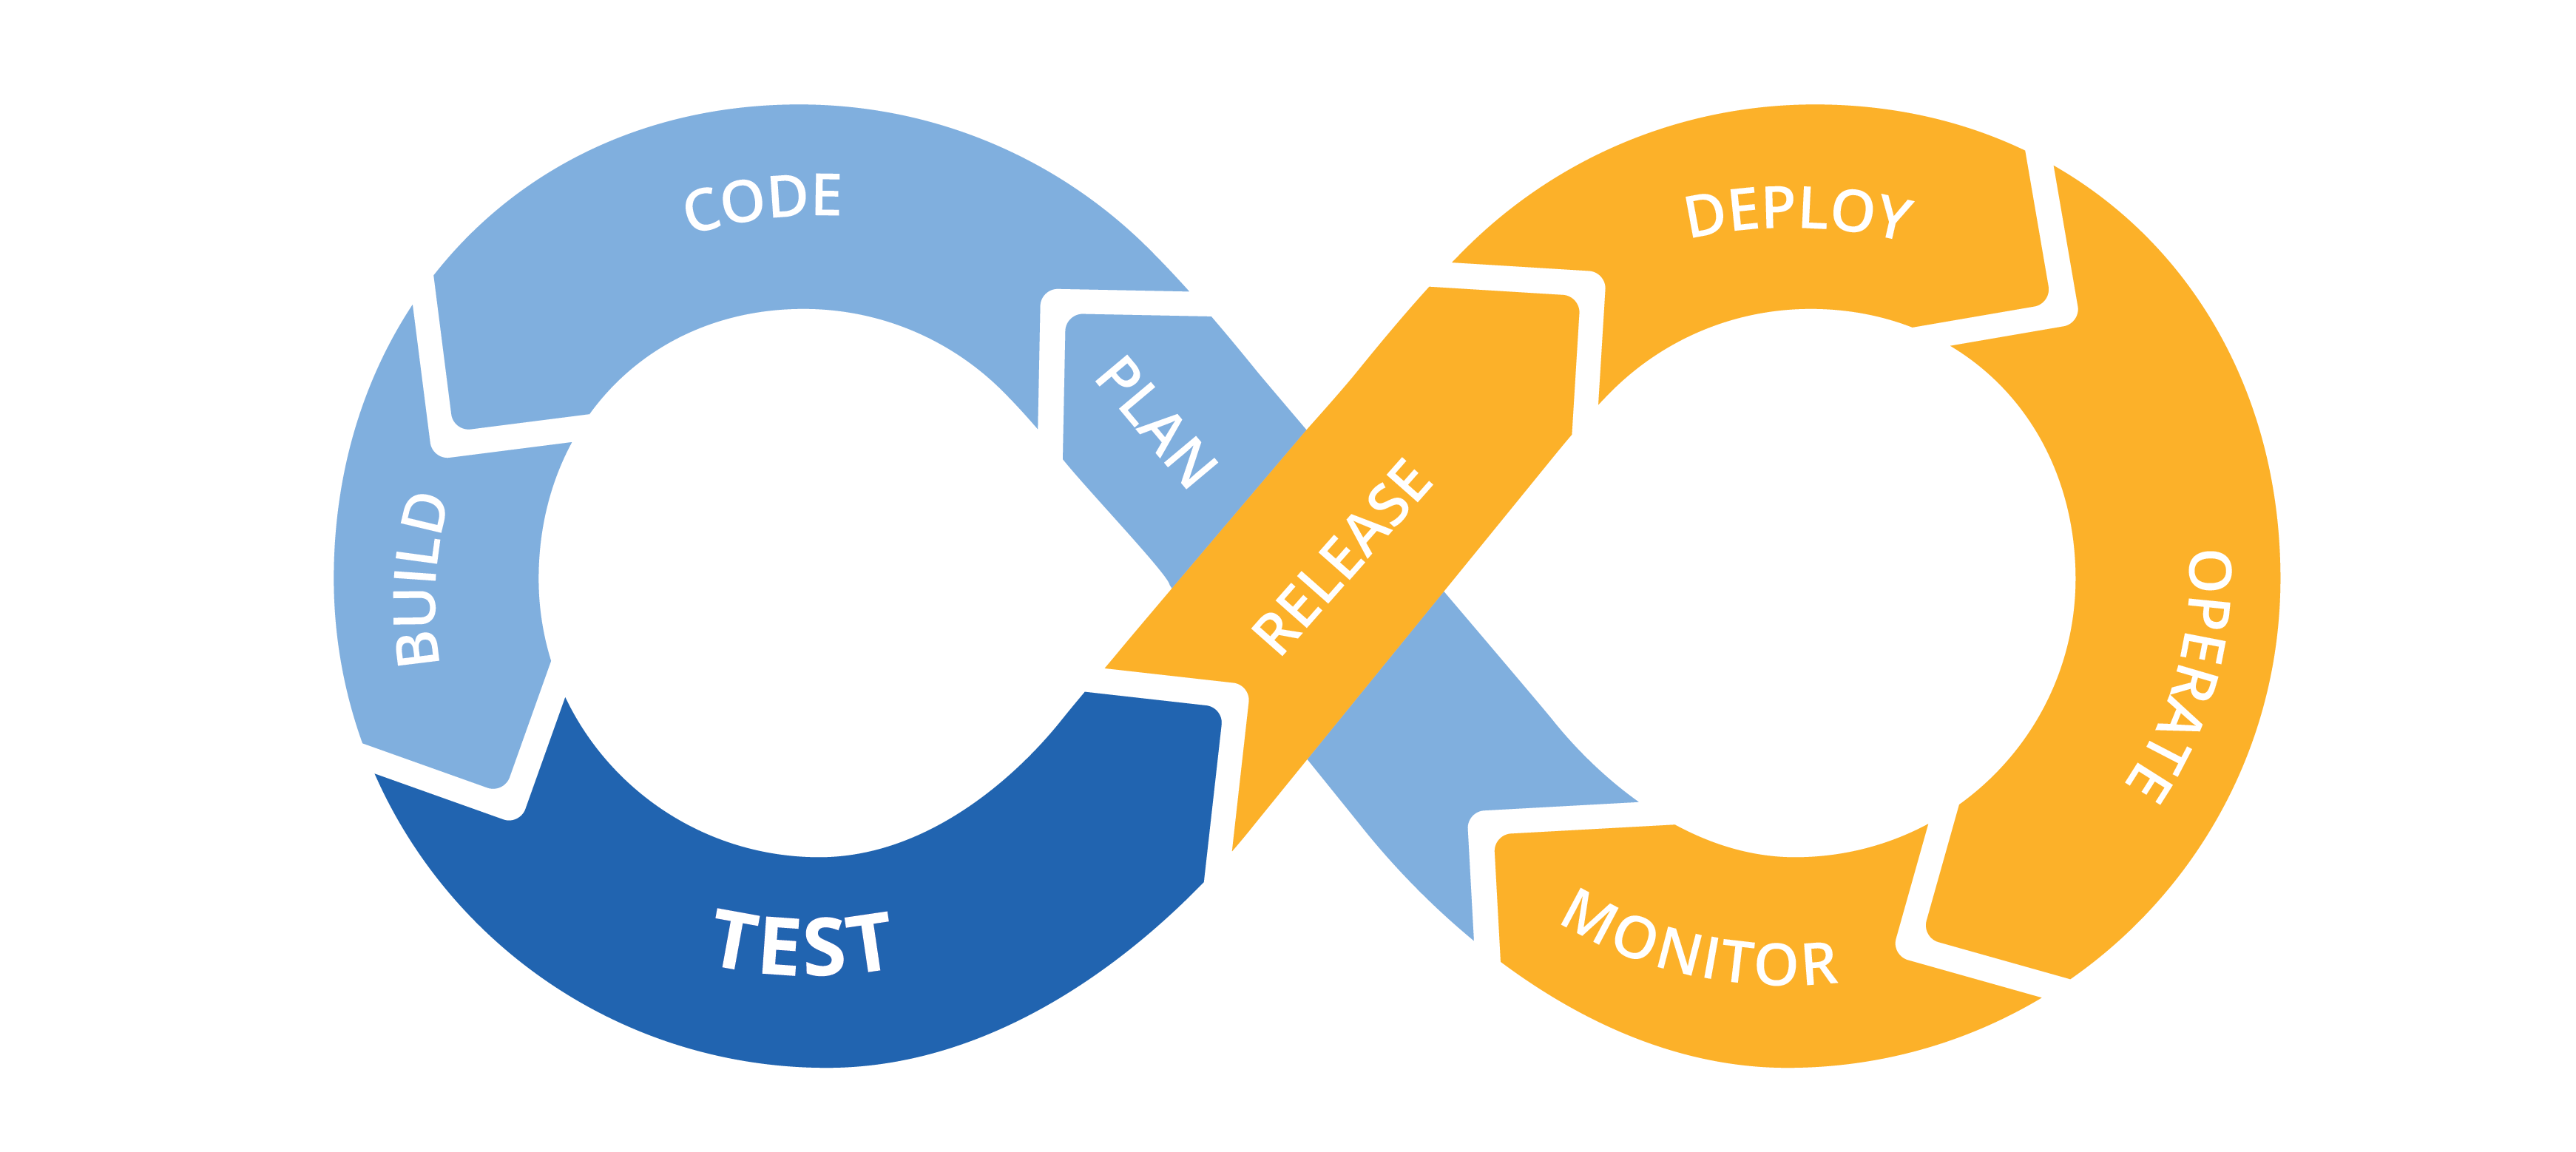 Image:
DevOps | freeCodeCamp Guide
Image:
DevOps | freeCodeCamp Guide
The NOS Team consists of one product owner, one designer, and five full-stack developers (two focus on the front-end and three focus on the back-end). We use Sprint methodology to organize the team’s work and iterate every two weeks.
Plan
In the NOS Team, we go through several meetings to ensure tasks are prioritized correctly and ensure they can bring actual value to our customers. We have:
- Triage — weekly meeting (1h30) to review tickets between product owner, designer, and developers to ensure the ticket is well understood before being inserted into the backlog.
- GoT — Gang-of-Three meeting (1h) between PO, designer, and tech lead to discuss the feasibility, timeline, product value, user-experience, technical constraints, etc. Actually, not only tech lead, but all developers can participate in this meeting.
- Poker — poker planning, the weekly meeting (1h) we have to understand what should be planned for the next sprint.
- Sprint Priorities — cross-team meeting (1h) between engineering teams (platform, NOS, UI, AI) to communicate the next priorities.
- Sprint Planning — bi-weekly meeting (1h) to review tasks done in the current sprint and plan for the next sprint.
- Retrospective — the review of the last sprint (1h) with an exclusive focus on the team members: what went well and what should be improved. The results are written as action points.
As a software engineer, my goal in the planning part is to participate in these meetings and provide technical information to help decision making. This is crucial for a software vendor like Nuxeo, which is heavily relied on technology. For cross-team changes, highlight the dependency between teams, understand their schedule, the time constraint, their capacity, the possible solutions, the history of some changes, etc. For team-internal changes, understand the importance of the issue, its difficulty, technical constraints, architecture, dependency with other issues, possible solutions and their trade-offs, acceptance criteria, etc. Ultimately, these efforts bring transparency to the team and facilitate decision making for the product.
Code
Development is my core activity. This year, I participated in different topics. If grouping them by service, there are Studio Service, Connect Dashboard Service, Marketplace Service, and Instance Registration Service. If grouping them by components, there are authentication, Docker image, Google Web Kit (GWT), logging, JGit, performance improvement, Tomcat, Nuxeo Framework, analytics, security, RESTful API, etc. Most of them are bug-fixes. I also did some changes around Git Server, Docker image, and performance improvement this year. Due to the time constraint, I cannot cover everything, so I just picked up three topics to share with you: bug-fixing, Git server, and performance improvement.
For bug-fixing, several aspects are very important: understand the problem, reproduce, solve, and test. First, you need to clarify the unclear detail and eliminate the confusing (irrelevant) information, then reproduce the problem yourself. Translate the description with accurate words will help. Reconstruct the timeline, find the missing technical information from the monitoring tool will help too. Try to simplify the reproduction steps and ensure they are deterministic. Sometimes this can be very hard, you need to cover all possible dimensions related to the same event and avoid making assumptions in the early stage. Debugging tools, audit events, and logs will help for finding out more information. Once done, it’s time to solve it. Depending on the severity, it can be a regular or an urgent ticket: for urgent tickets, it might be needed to split the solutions into workaround and real fixes, where workaround must be applied immediately and real fixes can be handled in a normal pace. Once the solution is found, we need to write tests to ensure the fix works as expected. This will be detailed in the next section. Once done, we also deploy the fix on a development environment so that either us or product team members (PO, QA) can validate the fix.
For Git Server, we have to host thousands of repositories for hundreds of customers in Nuxeo Online Services. We used to use GitLab Server (Community Edition), but due to several constraints in terms of maintenance, security, analytics, customizability, etc., we decided to develop our solution: Gitty, based on Eclipse JGit. JGit contains an HTTP module, which provides a Git Servlet. It can be deployed in any Java Servlet container effortlessly. This year, I contribute several patches in Git Server for adding the health-check, fixing security issues, improving logging, and creating new RESTful API endpoints. Collaborate with Cloud Team to provide infrastructure level changes: auto-scaling group, HTTP threads, connection pool, Apache rules, etc.
For performance improvement, I recently also did some improvements around nuxeoctl with Arnaud Kervern. We measured, profiled, and optimized the source code to make the processing faster. The API is nearly 5 times faster than before according to our engineering manager. This release will come very soon. For more information, see Performance Improvements on Nuxeoctl.
Test
In Nuxeo Online Services, we have a lot of bug-fixes to do. When we handle a ticket, we are facing several challenges: lack of software structure, tightly coupled class/methods, time limit, out-dated library, dependency constraint, lack of existing tests, etc. However, none of these can stop us from writing better software. That’s where testing comes into the screen. In terms of testing, we tried to improve the software as follows:
- Clarify the logic through refactoring
- Clarify the assumption and expected outcomes in test
- Leverage the power of testing frameworks
- Put the effort on the most mission-critical part
This year, I tried my best to practice test-driven-development (TDD): whenever the code is modified, new tests were added systematically. Not only the code coverage has been improved, but there was also extra-effort to keep the tests as simple as possible. In this way, it is easier to review and maintain. Also, test execution remains fast. In my opinion, the goal of writing tests is not to reach a certain coverage. Instead, the goal is to bring assurance to the software and bring confidence to our users. If you were interested, here are some blog posts I wrote about testing this year:
- Mockito: 4 Ways to Verify Interactions, 22 Sep 2019
- Project: NOS Test, 15 Sep 2019
- Mockito: 3 Ways to Init Mock in JUnit, 13 Sep 2019
- Measure Coverage with Coverage.py, 02 Sep 2019
- Testing with GwtMockito, 26 Aug 2019
- Fixing Comparator, 18 Jul 2019
- Design Pattern: Static Factory Method, 19 Feb 2019
- TDD: After 3 Months’ Practice, 05 Feb 2019
- Test Polymer 2 Using WCT, 09 Jan 2019
In the context of continuous delivery, having tests allows fast and deterministic feedback. If testing does not yield new information, defects will go undetected.
Build
Our build pipeline is very complex. Apache Maven is our primary build tool, but other tools are also involved in the build, such as Ant, Node.js, Polymer, Gulp, Bower, and tools for functional tests (Gecko-driver, Firefox). In the following paragraphs, I will share two things I did for the build: enable GitHub status in Jenkins CI and triggering Checkstyle automatically from GitHub.
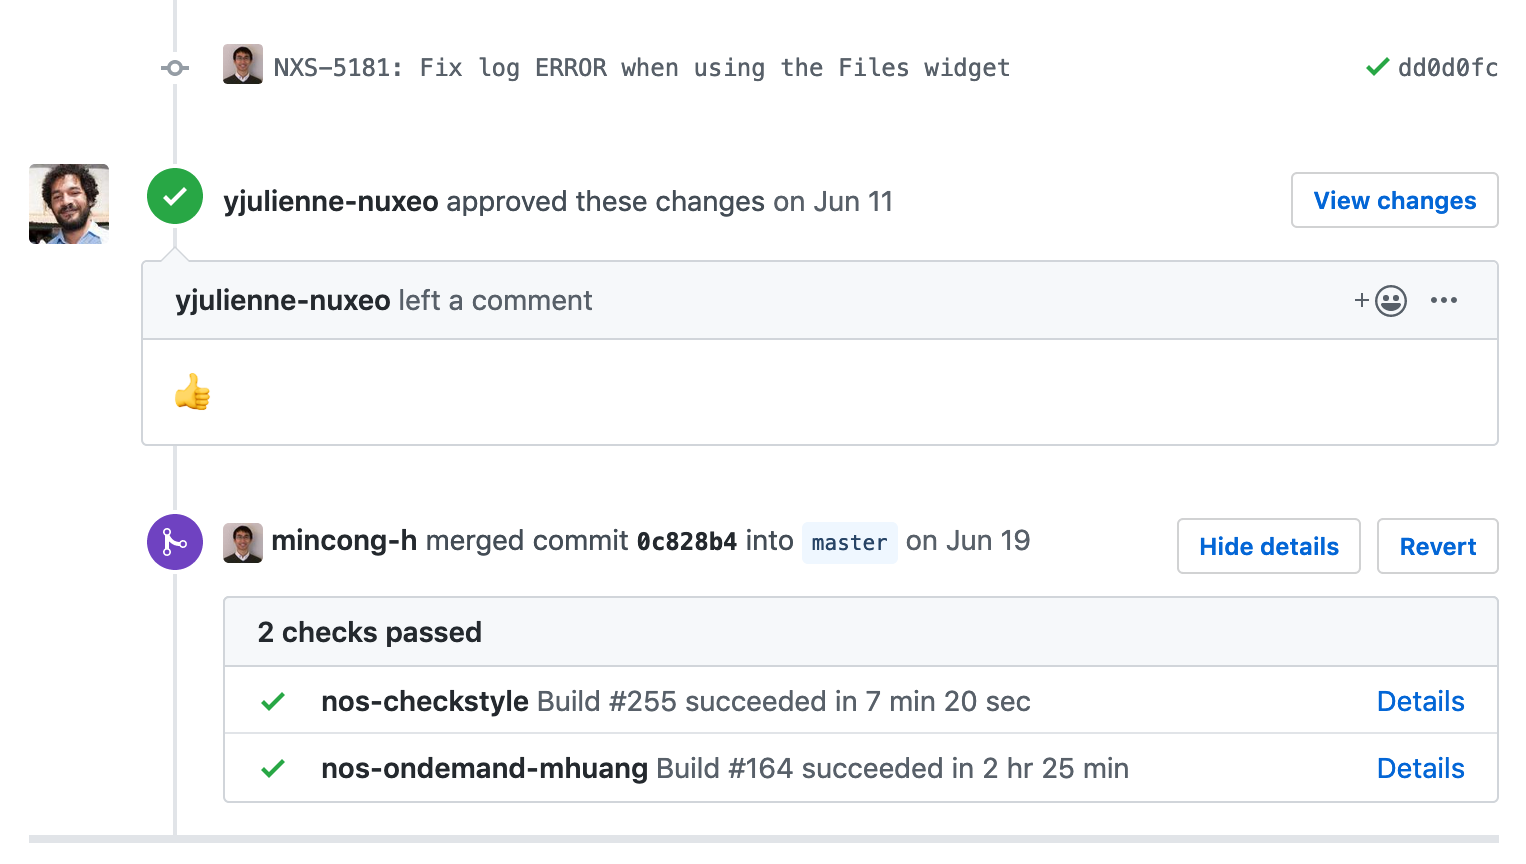
The NOS team does not set up restrictions to run all tests before merging the pull requests. Mainly because the tests are too long to execute (almost 3 hours), it might contain random failures. And in any case, the commit will be tested on the master branch before being released. However, it is still a big problem, especially at the end of sprint: when something went wrong on master, it was hard to tell which commit caused the problem as several commits were merged at the same time window and none of them was tested. It caused unnecessary troubles and stress. However, it is very hard to propose a simple and efficient solution with a personal effort. After many considerations, I finally found out a solution: enable the GitHub plugin on our Jenkins jobs which notifies GitHub at the start of the build (status: pending) and at the end of the build (status: succeeded or failed). Therefore, we can have a build status during the review. It makes the work visible and makes the process more transparent: reviewers are now able to evaluate the risk of changes without visiting Jenkins CI. If it were a small PR, we can eventually consider it’s OK and merge the PR without checks.
This year, I also started working on Checkstyle to build the rules according to Nuxeo’s coding conventions. For example, check CustomImportOrder had been added to ensure our import order is done correctly in Java files. You might not know, I’m a big fan of Maven, I wrote 17 articles about Maven in the last 3 years. You can check them here.
Release
At NOS, our release cycle is about two weeks: we create a new release after the end of each sprint. We use semantic versioning for our release versions: MAJOR.MINOR.PATCH. We adapted the version naming with our own needs, where we increment the:
- MAJOR version when upgrading our Nuxeo Server
- MINOR version when we perform bi-weekly release
- PATCH version when handling bug-fixes
My mission during the release phase is to ensure that new releases can be created on time with appropriate changes. This is done by reminding people the release day, reviewing the pull-requests, accelerating or postponing upcoming changes depending on the context, estimating the delivery volume and risk, etc. Doing so helps us deliver at a stable pace and have a predictable day for deployment.
Deploy
Deployment is handled by Nuxeo Cloud Team (formerly Nuxeo Cloud Operations Team). The deployment pipeline is a 100% automated process, mainly based on Ansible. Also, they use a blue-green deployment method, an effective way to update services with limited downtime. Even if the pipeline is 100% automated, there will still be an engineer which monitors the progress and handle the post-deployment tasks: manual switch from BLUE stack to GREEN stack; keep BLUE stack alive until GREEN stack is validated; trash BLUE stack or switch back depending on the context; etc.
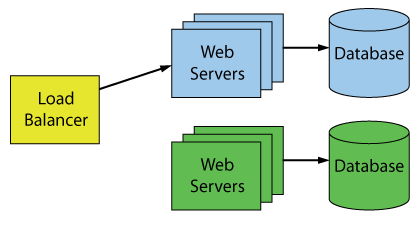 Image:
100 Percent Online Deployments: Blue-Green Deployment, Machael J Swart
Image:
100 Percent Online Deployments: Blue-Green Deployment, Machael J Swart
My mission in deployment is to coordinate with the Cloud Team to ensure the new release will be deployed on time and will be deployed successfully. The main challenges are:
- Check constraints before schedule – Avoid deployments during training weeks, hackathon, big demos, …
- Check availability – The Cloud Team has 30+ customers, so we need to avoid conflicts here.
- Perform post-deployment checks – Valide the new stack and provide feedback to them.
In the NOS Team, we used to perform post-deployment checks manually. We visited the most important pages of the website and ensure they can be loaded. As you can see, this process is manual and has very limited coverage. Since we need to do this repetitively, I created our new tool – NOS Checker (formerly NOS Test). It consists of three parts: browser checks (Selenium), API checks (JAX-RS/Jersey), and command-line checks (nuxeoctl). For the browser checks, it visits the target pages and ensures the behaviors are expected. For API checks, it sends HTTP requests to target APIs and asserts the response. For the command line, it downloads Nuxeo Server, registers the Nuxeo Server, and performs frequently used nuxeoctl commands. NOS Checker can also be run in performance mode, where hundreds of requests will be sent simultaneously. Then it calculates the meantime of these requests. It can also substitute a target user so that you can run it as presales, PS, support, or other profile. A human-readable report is generated at the end. If you’re interested in this tool, I have another blog post here: Project: NOS Test. In short, NOS Checker brings the post-deployment checks into the next level.
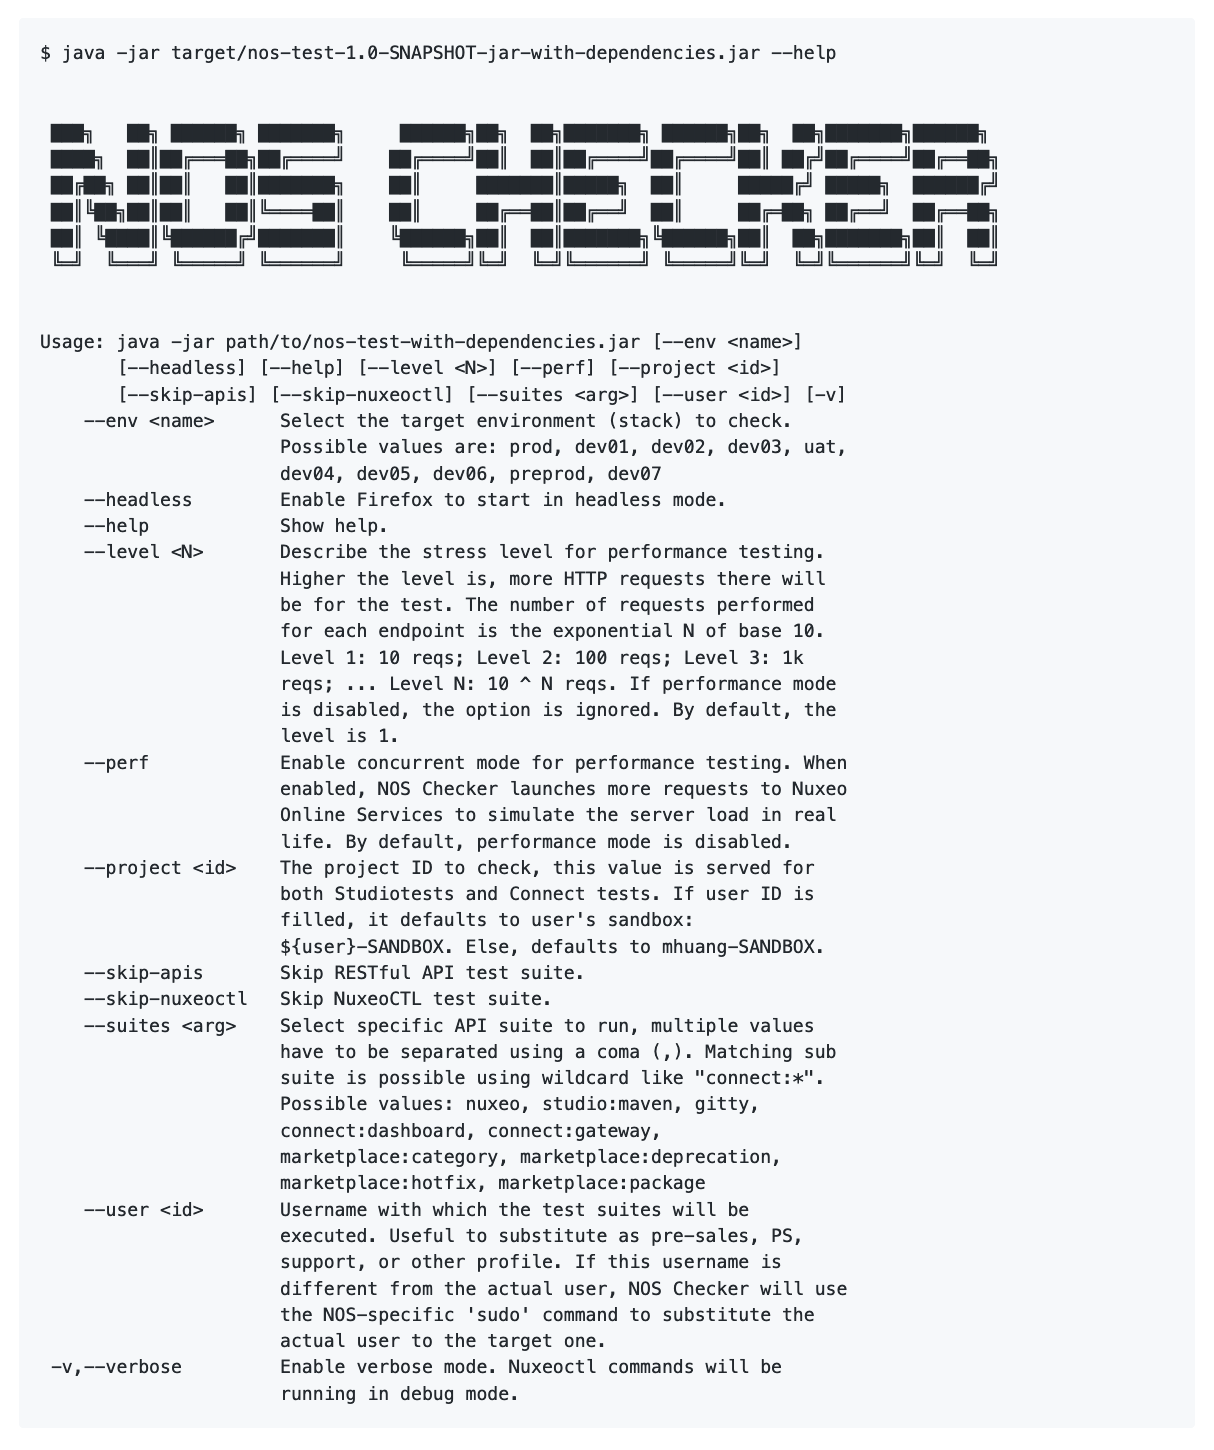 Image: Help message of NOS Checker
Operate
Operations are handled by the Cloud Team. However, due to the limited resources and the particularity of the NOS stack, they sometimes need help on our side. For example, we rely on Apache Access Logs and Datadog to understand the HTTP traffic. However, the JSON log generated by Apache Server was wrong, so we don’t get any useful insight from Datadog. Another example is the Apache URL rewrite-pattern has to be changed in the deployment pipeline, due to another change at the application-level. Although these changes are trivial to do, I want to highlight the impact here: at the operation level, many changes are time-related, they have to be done quickly. Without those changes, we will have big trouble on production: in those two examples, the first one could have caused API statistic problem on production (no data), the second one could have caused service unavailability for customers.
Monitor
Monitoring is important for understanding the health of our production environment and troubleshooting when a production incident happened. We mainly use Datadog, a cloud-based monitoring solution for doing it. In Datadog, we set up dashboards to monitor our HTTP traffic (volume, 4xx errors, 5xx errors), Java web servers (memory, threads, GC, session), database (connection pool, size, CPU), hard disk, etc.
 Image:
Datadog
Image:
Datadog
On my side, I created “qWatch” project: qWatch stands for “Quality Watch”, it analyzes the quality of the software based on Datadog Logs — I download logs from Datadog Logs web page regularly and match them with predefined log patterns. Each pattern represents an exception in the software. It allows us to detect software anomalies, based on their frequency, their age, their impact and more. It allows us to have precious feedback before the error goes critical. Also, it allows us to prioritize the most critical ones, group them by components since we have more insights right now.
Recently, I also created a dashboard for HTTP and database. Based on our previous experience, the database has a significant correlation with the HTTP traffic. Different from the existing dashboard, this one focuses exclusively on HTTP traffic — the volume of the traffic, the distribution per service, the response time, etc. The graphs are created based on log events and metrics. The objective is to:
- Better monitor the database (RDS) activity
- Better understand the activity of each API
- Find out the eventual correlation between the database, JVM and the HTTP traffic
I also use Datadog frequently for troubleshooting, especially with logs. Thanks to the log entries and all its metadata, it helps to understand the context of the exception, the root cause, what happened in that context (near time) on that machine or on the entire cluster, the severity, the frequency of the same error, eventual workaround. It also helps to set up an alert (monitor) based on the known log events. Or set up a graph in a dashboard to keep track of the evolution of the same error pattern.
Conclusion
In this article, I shared with you how the team works and what I did as a software engineer at Nuxeo over 8 parts: plan, code, test, build, release, deploy, operate, and monitor. As you can see, being a software engineer is far more than just writing code. It comes with the responsibility of taking care of the stack and deep collaboration with other teams. In the end, I would like to give share 10 tips that works well as a software engineer, based on this year’s experience at Nuxeo:
- Be data-driven
- Have full ownership of your stack (Dev + Ops)
- Test-driven development (TDD)
- Communication is the key
- Prefer automation over manual process
- Cross-domain skills (scale horizontally)
- Keep learning
- Team spirit
- Product first
- Shift left
Interested to know more? You can subscribe to my feed, follow me on Twitter or GitHub. Hope you enjoy this article, see you the next time!
References
- Ansible, “Ansible is a radically simple IT automation platform that makes your applications and systems easier to deploy”, GitHub, 2019. https://github.com/ansible/ansible
- Michael J Swart, “100 Percent Online Deployments: Blue-Green Deployment”, Michael J Swart’s Blog, 2018. https://michaeljswart.com/2018/01/100-percent-online-deployments-blue-green-deployment/
- freeCodeCamp, “DevOps”, freeCodeCamp, 2019. https://guide.freecodecamp.org/devops/
- GitLab, “The single application for the entire DevOps lifecycle”, GitLab, 2019. https://about.gitlab.com/