Introduction
In the previous article “DVF: Indexing New Documents”, we talked about how to index new documents in Elasticsearch using the open data DVF. However, the performance is not optimized because we can only index 64.9 documents/s. In this article, I am going to share with you two tricks to improve the indexing speed: using bulk index request and using multi-threading.
After reading this article, you will understand:
- How to prepare the CSV reader (Jackson) for bulk processing?
- How to create bulk-index-request in Elasticsearch?
- How to perform index requests concurrently using a thread pool and how to control its parallelism
Bulk Iterator
To add multiple documents into a single bulk request, it’s better
to provide a stream of lists of documents as Stream<List<ImmutableTransaction>> as
an input parameter for the method which prepares the bulk request. However, it’s
not the value returned by the CSV reader.
Currently, the CSV reader returns a stream of transactions as
Stream<ImmutableTransaction>. In this section, I am going to explain how to
modify it. To better illustrate the changes, you can see the difference as
follows:
 public class TransactionCsvReader {

-  public Stream<ImmutableTransaction> readCsv(Path path) {
+  public Stream<List<ImmutableTransaction>> readCsv(Path path) {
     try {
       Iterator<ImmutableTransactionRow> iterator = objectReader.readValues(path.toFile());
+      var bulkIterator = new BulkIterator<>(iterator, bulkSize);
-      return StreamSupport.stream(Spliterators.spliteratorUnknownSize(iterator, ORDERED), false)
+      return StreamSupport.stream(Spliterators.spliteratorUnknownSize(bulkIterator, ORDERED), false)
           .map(rows ->
               rows.stream()
                   .map(TransactionRow::toTransactionObj)
                   .collect(Collectors.toList())
           );
     } catch (IOException e) {
       throw new IllegalStateException("Failed to read file " + path, e);
     }
   }
   ...
 }
The idea is pretty simple: create a new BulkIterator to encapsulate the existing
iterator returned by Jackson and provide a parameter bulkSize to control the
level of bulking. Besides that, using iterator ensures that the deserialization
is done lazily, i.e. deserialize the row when the object reader actually reaches
that row. It avoids out-of-memory errors in the JVM and keeps the memory usage
efficient.
Now, let’s take a look at this bulk iterator.
static class BulkIterator<T> implements Iterator<List<T>> {
  private final Iterator<T> iterator;
  private final int bulkSize;

  public BulkIterator(Iterator<T> iterator, int bulkSize) {
    this.iterator = iterator;
    this.bulkSize = bulkSize;
  }

  @Override
  public boolean hasNext() {
    return iterator.hasNext();
  }

  @Override
  public List<T> next() {
    if (!hasNext()) {
      throw new NoSuchElementException();
    }
    var results = new ArrayList<T>(bulkSize);
    while (hasNext() && results.size() < bulkSize) {
      results.add(iterator.next());
    }
    return results;
  }
}
In the constructor, we accept an external iterator (the one created by Jackson
object reader) and the bulk size for creating bulk. The hasNext() calls that
underlying iterator so that this iterator and the underlying iterator are
aligned about the current position. As for next(), the iterator moves forward
N steps to create a bulk as a List<T>. It stops when the bulk is full or when
the underlying iterator is exhausted. Following the specification of iterator
(see Javadoc), it throws an exception when there is no more element.
Bulk Index Request
Once we have the structure Stream<List<ImmutableTransaction>>, the next step
is the create a BulkRequest for each item in the stream, i.e. each list of
transactions (List<ImmutableTransaction>). Java High Level REST Client
provides a class BulkRequest to call the Bulk
API
of Elasticsearch. In the code snippet below, you can how to do that step by
step. The first step is to create a bulk request. Then, for each transaction in
the list, we serialize it as JSON and create an invividual index request. Then,
we add each index request into the bulk request. Finally, we submit the request
to the Bulk API and retrieve the bulk response.
var bulkRequest = new BulkRequest();

for (var transaction : transactions) {
  try {
    var json = objectMapper.writeValueAsString(transaction);
    bulkRequest.add(new IndexRequest(indexName).source(json, XContentType.JSON));
  } catch (JsonProcessingException e) {
    // This should never happen
    throw new IllegalStateException("Failed to serialize transaction " + transaction, e);
  }
}
var response = client.bulk(bulkRequest, RequestOptions.DEFAULT);
But you may ask: how much do we improve by using Bulk API instead of the normal Index API? To compare the difference, I did a small benchmark using two computers: my Macbook Pro 13 and my Toshiba KIRA, respectively for the Elasticsearch client and the Elasticsearch server. Both of them are a bit outdated these days, but they are still providing valuable results as we will see right after. I need two machines because I don’t want the settings of the Java client to impact the performance of Elasticsearch. If you are curious about the specification of these machines, you can find them as follows:
- Macbook Pro (Retina, 13-inch, Early 2015)
- Processor: 2.7 GHz Dual-Core Intel Core i5
- Memory: 8GB 1867MHz DDR3
- Toshiba KIRA
- Processor: Intel(R) Core(TM) i7-4510U CPU @ 2.00GHz
- Memory: 8GB 1600MHz DDR3
On the Toshiba KIRA side, I started a Docker container of Elasticsearch 7.10.1 as what we did in the last article. Now, everything is ready, we can start the comparison of different bulk sizes for real.
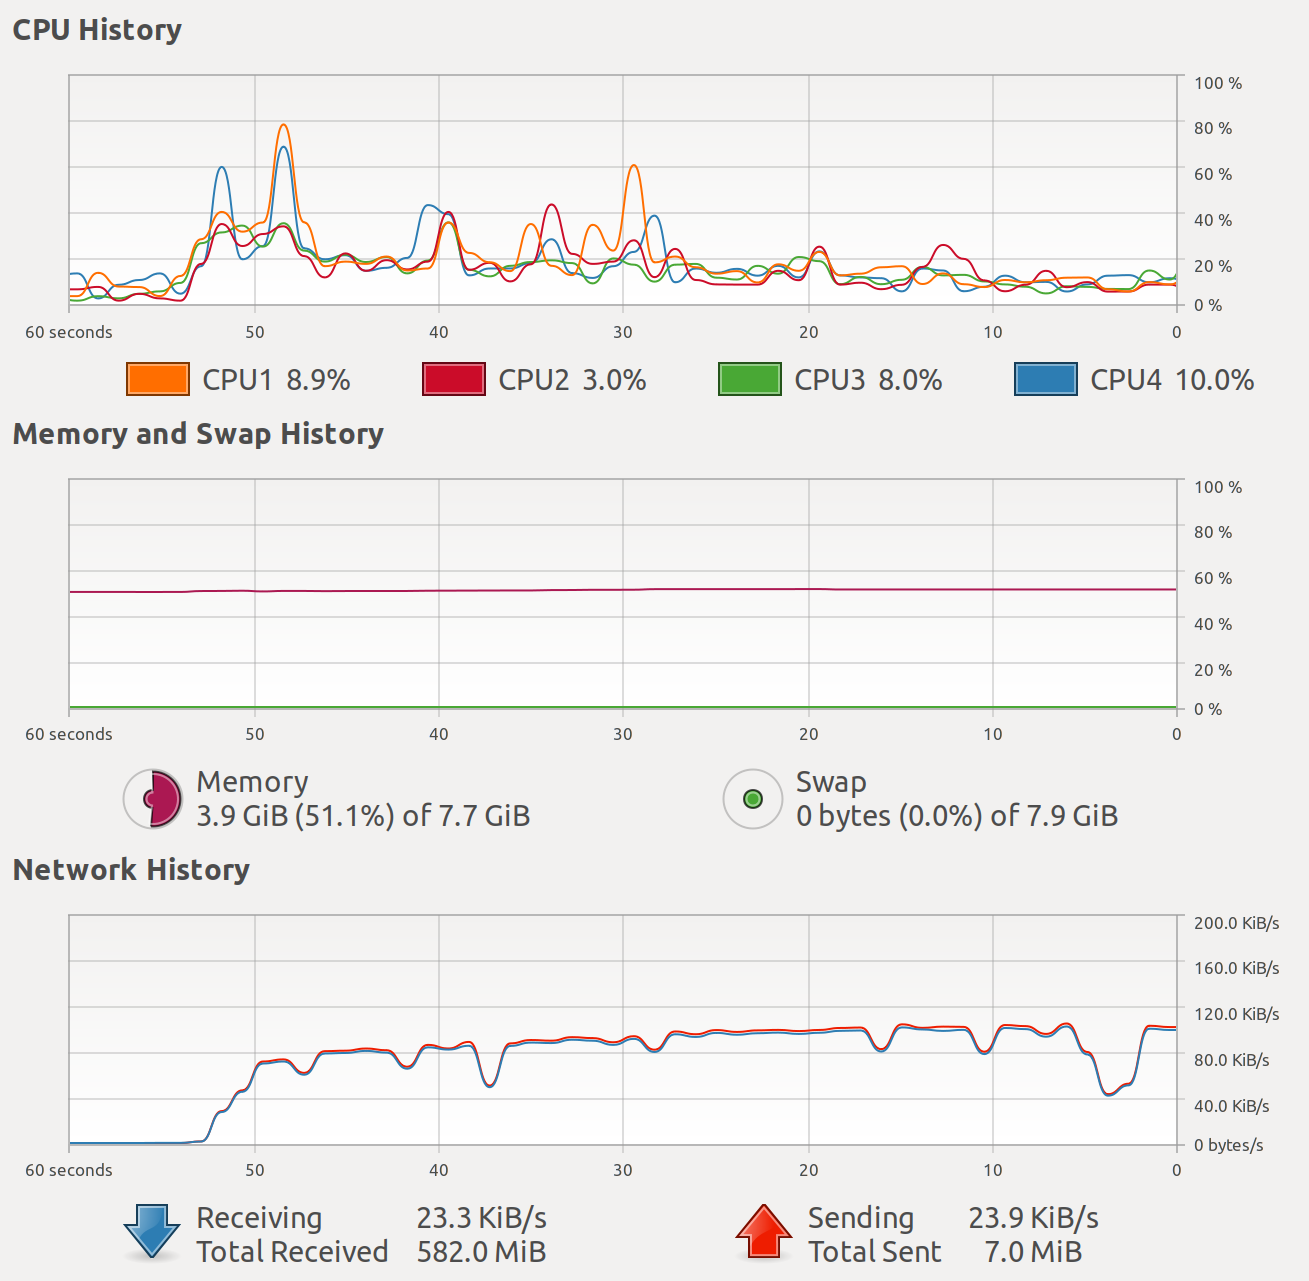
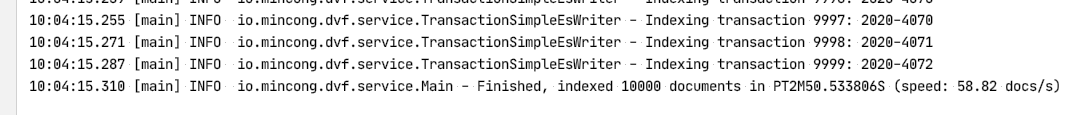
In the screenshot below, you can see the CPU usage, memory usage, and the network usage of the host running the Elasticsearch server (Toshiba KIRA) without bulk request API. The performance is not optimal: the CPU usage is low and the network traffic is low as well. From the client-side logs, we can see that we only indexed 10,000 documents in 2 minutes and 50 seconds, which is 58.82 documents/s. In this speed, we need about 827,106 / 58.82 / 3600 = 3.91 hours to index the full dataset. 😅
Now, let’s see if the performance can be improved by increasing the bulk size to 10, 100, 1000:
| Bulk Size | Indexing Duration | Indexing Speed |
|---|---|---|
| 1 | (estimated) 3h54m00 | 58.8 docs/s |
| 10 | 26m49 | 514.1 docs/s |
| 100 | 6m04 | 2,272.3 docs/s |
| 1,000 | 3m16 | 4,219.9 docs/s |
As you can see, the performance is improved significantly when we increase the bulk size. However, we can also observe that the improvement is not proportional: when we bulk 10 times more, the speed does not necessarily improve 10 times. There are several reasons: the first reason is that when the client is preparing the request, the server is idle — it already finished the previous tasks. The second reason is that the client is running synchronously in a single thread, so it couldn’t prepare enough tasks in parallel and it is idle when waiting for the bulk response from Elasticsearch.
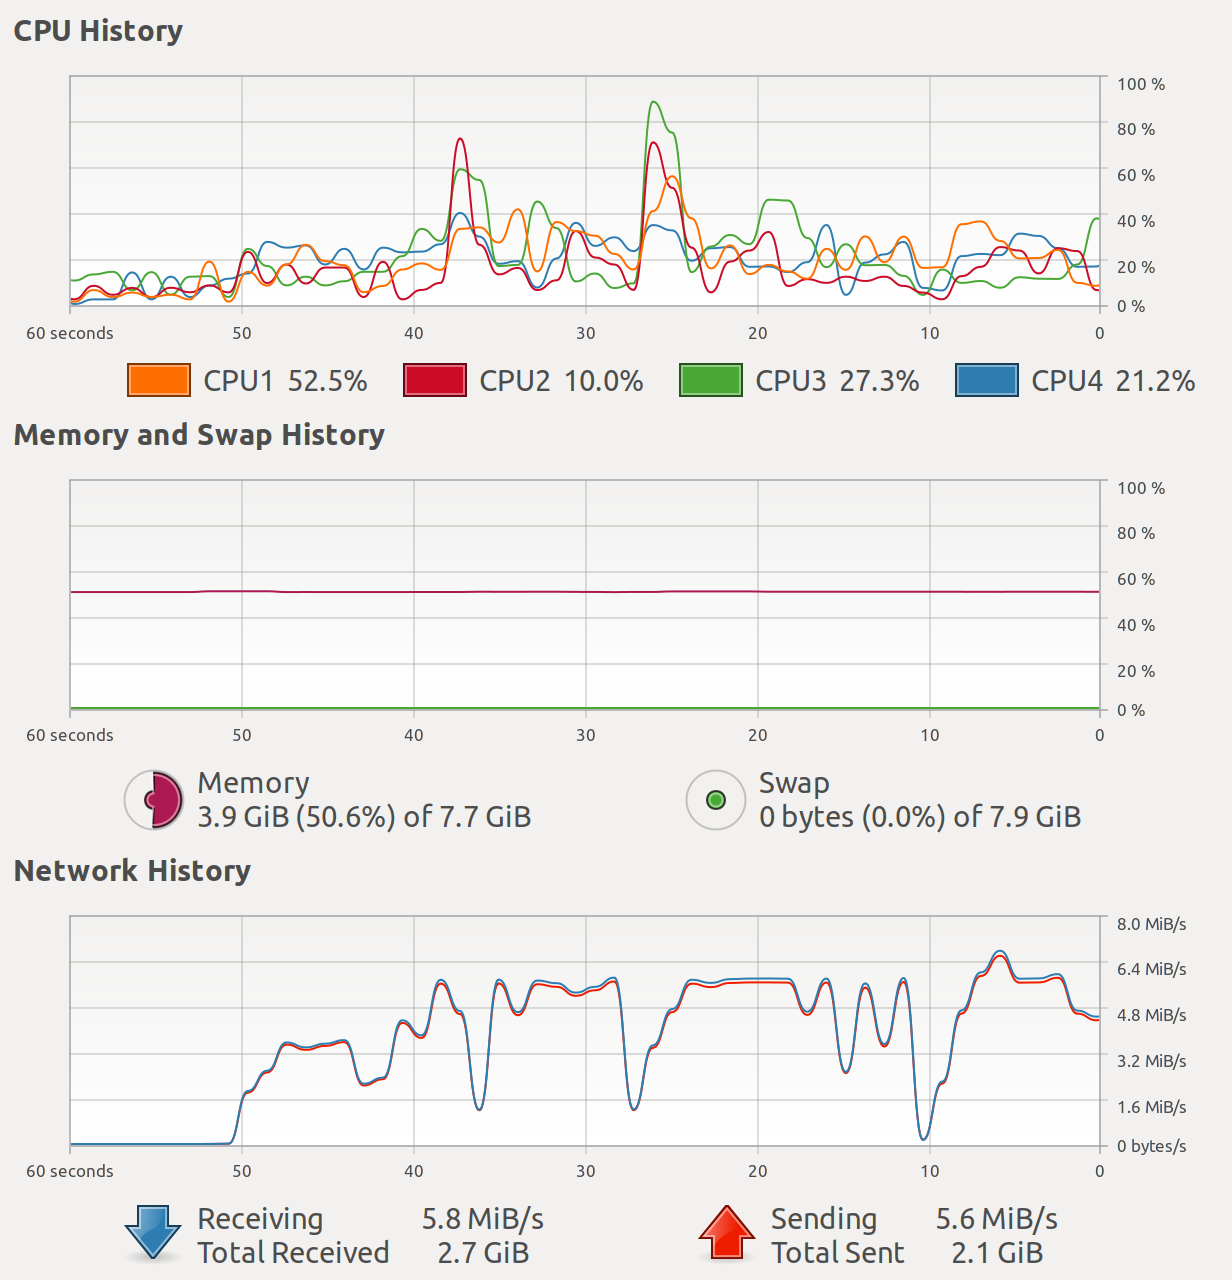
From the screenshot below, you can see the CPU usage, memory usage, and the network usage of the host running the Elasticsearch server (Toshiba KIRA) when the bulk size is set to 1,000. You can see that the 4 CPU cores are not fully used.
In the next section, we are going to discuss how to improve the situation again using multi-threading.
Multi-Threading
To implement a multi-threading solution, we need to match two criteria:
- We need to find a Java class to support the concurrent execution, such as
Thread,Runnable,FutureorCompletableFuture. - We need to fina a way to control the parallelism, such as using a thread pool.
For the first point, I chose CompletableFuture because it extends the
interface Future and it supports multi-stage executions since it extends
CompletionStage as well. It’s very similar to promise in the JS world. Using
it facilitates the interaction with a thread pool because most of the methods
contain an asynchronous version using suffix *Async, such as thenApplyAsync,
thenRunAsync, etc. By calling these APIs, the execution of the stage will be
done inside the target executor rather than the current thread.
For the second point, the thread pool, I chose the fixed thread pool because we need a strong
control about the parallelism of the number of threads. We are going to compare the
indexing performance when using 1 thread, 4 threads, 8 threads, and 16 threads
on the client-side. Yes, on the client-side. Please don’t confuse about the
server-side: here we’re investigating improvements on the Java High Level REST
client, not the server. Now, I am going to use the API supplyAsync to wrap
the blocking indexing logic index(...) into a completable future:
private CompletableFuture<List<String>> indexAsync(List<ImmutableTransaction> transactions) {
  return CompletableFuture.supplyAsync(() -> index(transactions), executor);
}
And on the caller side, the transaction stream is converted into a stream of
futures. Using CompletableFuture#allOf(...), we will wait until the completion
of all the futures before considering the current future as complete:
public CompletableFuture<List<String>> write(
  Stream<List<ImmutableTransaction>> transactions) {
  var cfs = transactions.map(this::indexAsync).collect(Collectors.toList());
  return CompletableFuture.allOf(cfs.toArray(CompletableFuture[]::new))
      .thenApply(...);
}
The code snippets above sound a bit abstract. All you need to remember is that we are changing the number of threads to see how it impacts the indexing speed. We are going to test it against two factors:
- Bulk size: 10, 100, 1000
- Parallelism: 1, 4, 8, 16
As a reminder, I’m testing it using two computers: Macbook Pro 13 for the client and Toshiba KIRA for the server. After testing a few hours, the results are as follows:
| Item | Bulk Size | Threads | Indexing Duration | Indexing Speed |
|---|---|---|---|---|
| B1-T1 | 1 | 1 | (estimated) 3h54m00 | 58.8 docs/s |
| B10-T1 | 10 | 1 | 26m49 | 514.1 docs/s |
| B10-T4 | 10 | 4 | 8m19 | 1,657.5 docs/s |
| B10-T8 | 10 | 8 | 5m04 | 2,720.7 docs/s |
| B10-T16 | 10 | 16 | 3m58 | 3,475.2 docs/s |
| B100-T1 | 100 | 1 | 6m04 | 2,272.3 docs/s |
| B100-T4 | 100 | 4 | 2m05 | 6,616.8 docs/s |
| B100-T8 | 100 | 8 | 1m25 | 9,730.6 docs/s |
| B100-T16 | 100 | 16 | 1m21 | 10,211,2 docs/s |
| B1000-T1 | 1,000 | 1 | 3m16 | 4,219.9 docs/s |
| B1000-T4 | 1,000 | 4 | 1m31 | 9,089.1 docs/s |
| B1000-T8 | 1,000 | 8 | 1m14 | 11,177.1 docs/s |
| B1000-T16 | 1,000 | 16 | 1m10 | 11,815.8 docs/s |
If we pivot the table and focus on the indexing duration, we can see them as the table below. As you can see, when the bulk size increases, the duration decreases. Same for the number of threads. To make the indexing efficient (less than 1 min 30), we need to use at least 8 threads and a bulk size equal to or higher than 100 items per bulk, where 8 threads are twice the amount of logical processor (4) in my Macbook Pro 13. I believe this is because the tasks are blocking, they spend lot of time waiting for the response from Elasticsearch and they are not CPU-intensive.
| Bulk Size | 1 Thread | 4 Threads | 8 Threads | 16 Threads |
|---|---|---|---|---|
| 10 | 26m49 | 8m19 | 5m04 | 3m58 |
| 100 | 6m04 | 2m05 | 1m25 | 1m21 |
| 1000 | 3m16 | 1m31 | 1m14 | 1m10 |
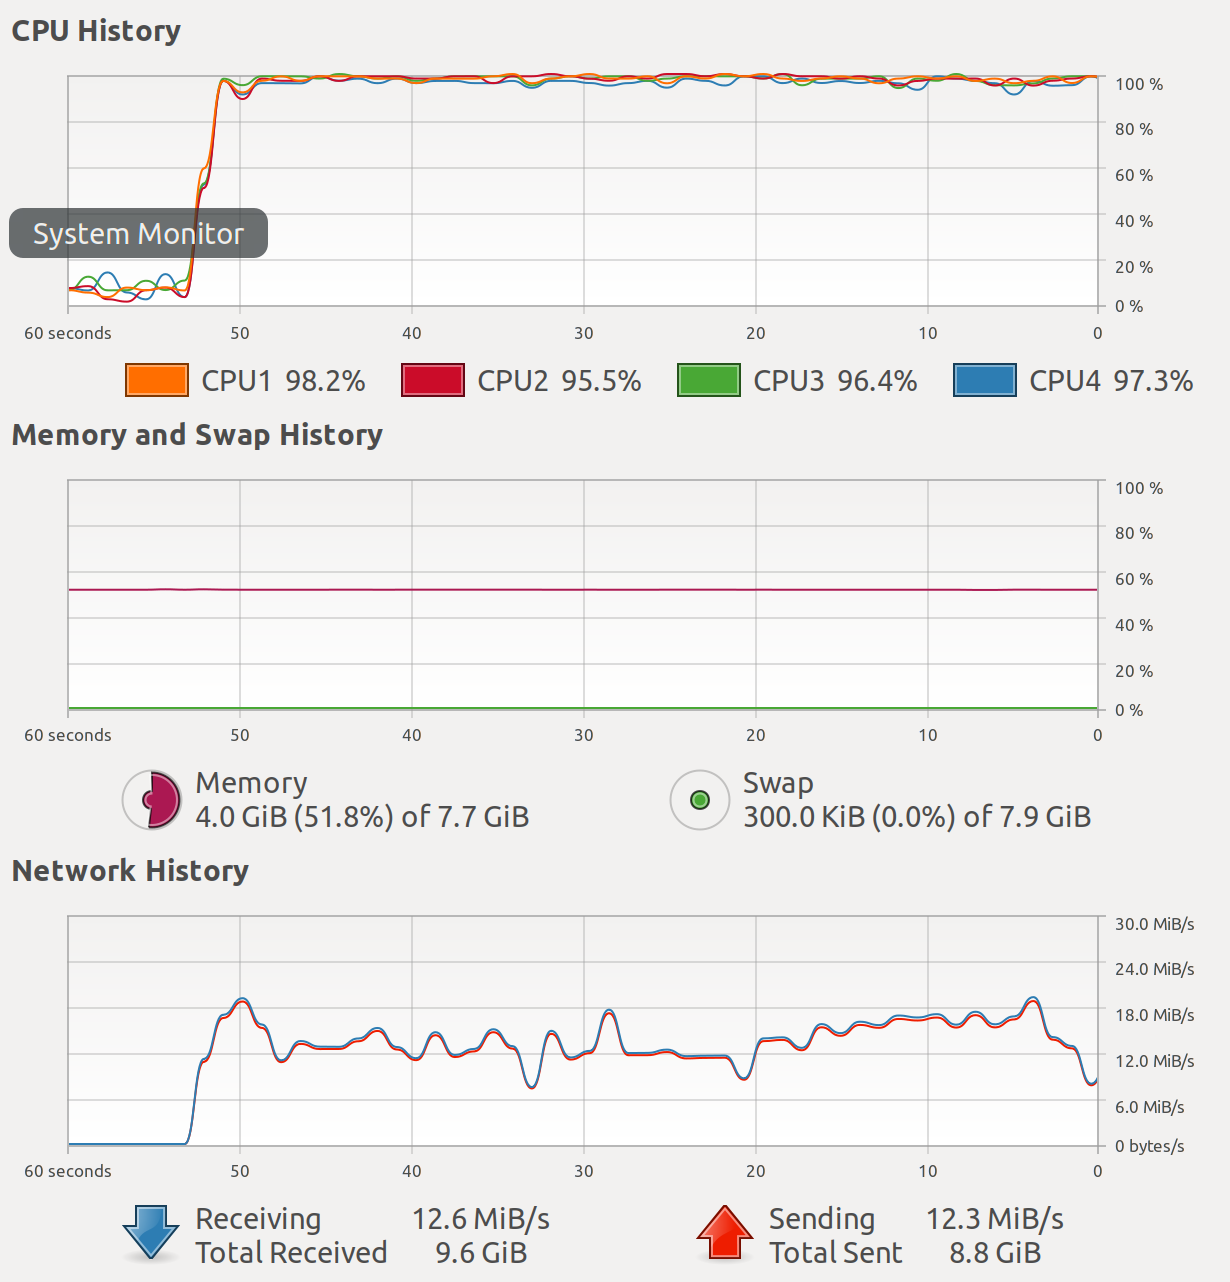
If we take the fastest case in the table, which is using bulk size 1000 and 16
threads (B1000-T16), you can see the resource usage as follows. You can see
that the 4 CPU cores are used to 100% and the host received more than 12MB/s. We
can say that in this case, the CPU is fully used compared to previous cases.
Although the indexing speed is amazing in this example, it does not mean that the settings should be this aggressive if you run an Elasticsearch cluster yourself. There are factors to be considered, such as search activity, relocations, and snapshot activity. Searching takes time, especially the complex queries. Shard relocations take time as well. Relocating a shard being actively writing can lead to huge translog. Snapshot-related actions (creation, restore, …) can also increase CPU usage. There can be other cases, the best solution is to add a monitoring solution to better observe the cluster.
Going Further
How to go further from here?
- To better understand the Bulk API in Elasticsearch, visit REST APIs - Bulk API
- To better understand the Bulk API in Java High Level REST Client, visit Java High Level REST Client - Bulk API
- In this article, we focus on the improvements to the Elasticsearch client. But do
you know that the cluster side settings are even more important? In
Elasticsearch 7, indexing is done using the
writethread pool. To better understand the different thread pools and their related settings, visit Thread pools. - Another way to improve indexing performance is to use multiple shards for one index. Each Elasticsearch shard is a Lucene index. You can find the shard definition in the Glossary of terms and visit the page How to size your shards? to understand how to size the index correctly.
If you are interested in the source code of this article, you can find it on GitHub in my project mincong-h/learning-elasticsearch under the folder demo-dvf.
Conclusion
In this article, we saw how to optimize the indexing speed in Elasticsearch by going through three steps: prepare the iterator for bulk processing; use bulk request rather than individual index requests; use completable future and executor to make the execution in parallel. Then we compared the performance by adjusting the bulk size and the number of threads. We saw that having a bulk size of 100+ and using multiple threads increase significantly the performance. We were able to increase the indexing speed from 58.8 docs/s to 11,815.8 docs/s which is 200 times of improvement and reduced the indexing duration by 99.6%. Interested to know more? You can subscribe to the feed of my blog, follow me on Twitter or GitHub. Hope you enjoy this article, see you the next time!
References
- Elasticsearch, “Java High Level REST Client - Bulk API”, 2020. https://www.elastic.co/guide/en/elasticsearch/client/java-rest/7.x/java-rest-high