Introduction
Open data “Demande de valeurs foncières géolocalisées (DVF)” is an open dataset provided by the French government which collects all the real-estate transactions since January 2014, in mainland France and the overseas departments and territories, except in Mayotte and Alsace-Moselle. Today, we are going to explore this dataset using Elasticsearch and Kibana. In particular, we are going to study the real estate market of Île-de-France in 2020.
After reading this article, you will understand:
- The prerequisite before the analytics
- The overview of the market Île-de-France
- The comparison of apartments and houses
- Some more specific analytics on apartments
Globally, the idea is to see the big picture and identify some valuable factors to study. Then step-by-step, we will go into a more specific direction to go further in our exploration. Now, let’s get started!
Prerequisite
Before the analytics, we need to prepare the dataset. Here, I am using Elasticsearch and Kibana. For those who don’t know Elasticsearch, Elasticsearch is a distributed, RESTful search and analytics engine. As for Kibana, Kibana is a free and open user interface that lets you visualize your Elasticsearch data and navigate the Elastic Stack. The steps of the preparation are mainly the following ones:
- Download the dataset from https://www.data.gouv.fr
- Design the data model and index them into Elaticsearch
- Optimize the storage for search
- Set up Kibana and create dashboards to analyze the data
To set up Elasticsearch, you can use Docker: just running a Docker container in localhost and you are ready to go. The same thing applies to Kibana. However, you need to give the name of the Elasticsearch cluster to Kibana so that they can be linked together. Here, I am using the names “elasticsearch-dvf” and “kibana-dvf” to achieve that. Once the setup is done and the indexing process is finished, you can see all the data in Elasticsearch. There are several gigabytes (GB) of data:
➜  curl "localhost:9200/_cat/indices/transactions.*"
yellow open transactions.2019 ExlbB3EuQSqk__4MEW6eHQ 1 1 3142952 0 802.3mb 802.3mb
yellow open transactions.2018 1B3pKi4URDar2w0vAvPysA 1 1 3319426 0 853.3mb 853.3mb
yellow open transactions.2017 HJLTdbbtSqW686jQFzgg7g 1 1 3381190 0 862.4mb 862.4mb
yellow open transactions.2016 ZNPlUNeTStS8KsOgvaMTww 1 1 2939004 0 753.5mb 753.5mb
yellow open transactions.2015 h2CEOxWzTYymAt9KBMasJg 1 1 2750305 0 704.1mb 704.1mb
yellow open transactions.2014 17ZVk9oMQ6KmvTpMgGdMBg 1 1 2516802 0 650.7mb 650.7mb
yellow open transactions.2020 Khw7RAl1RcCDeLlz8Blt7g 1 1 2459560 0 623.5mb 623.5mb
On the Kibana side, we need to define an index pattern transactions.* that
matches all the indices mentioned above.
Since this is not aimed to be a technical blog, I am going to skip the
technical details here. If you were interested in the entire preparation, you
can see my previous articles on the series page “DVF”.
Starting from the next section, we are going to analyze the data of Île-de-France, the Greater Paris area. It consists of 8 departments:
- Paris (75)
- Hauts-de-Seine (92)
- Seine-Saint-Denis (93)
- Val-de-Marne (94)
- Seine-et-Marne (77)
- Yvelines (78)
- Essonne (91)
- Val-d’Oise (95)
Overview
Transactions 2020
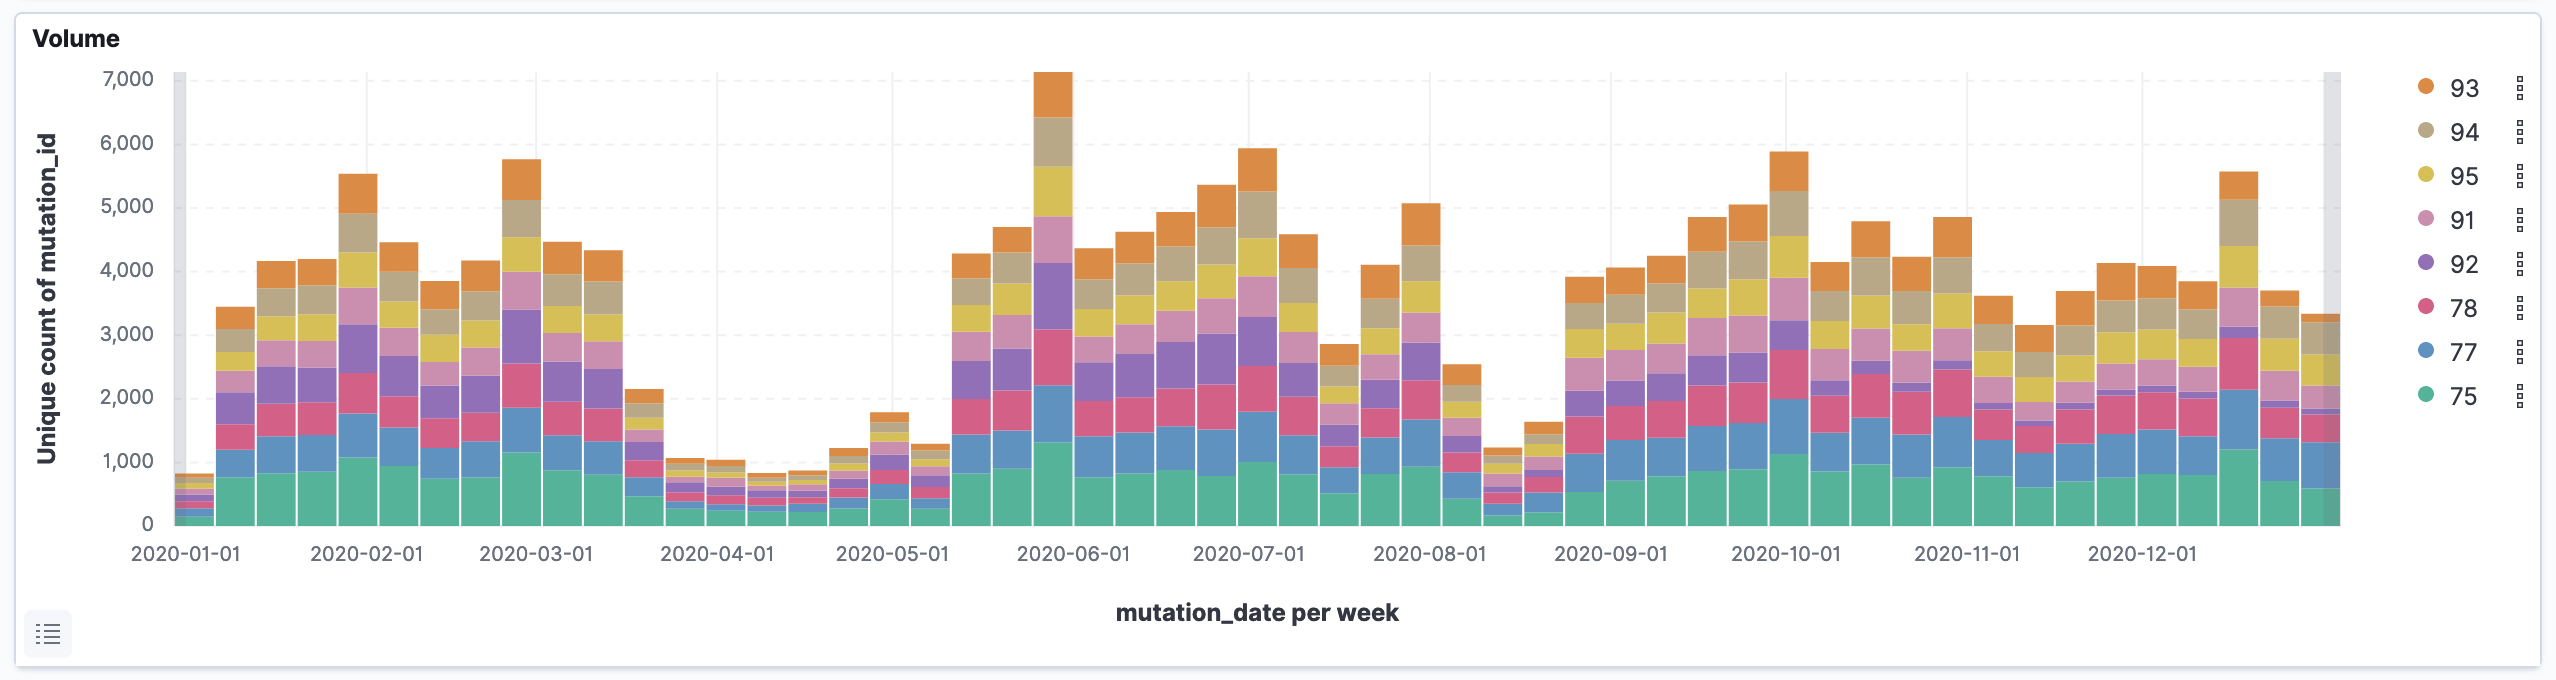
First of all, let’s take a look at the global landscape of the real estate market of Île-de-France in 2020. There were 146,084 transactions happened in this area with 387,425 mutations (*). From the widget above, we can see the number of mutations over the year. The real estate market was active despite the pandemic. However, the number of transactions was greatly reduced between the end of March and mid-May, probably because of the first lockdown measure taken by the French government. After that period, the market quickly regained its dynamics.
(*) One mutation represents a transfer of ownership of a given premise. A premise can be an apartment, a house, a cellar, etc. Each transaction contains one or multiple mutations. For example, you can buy one apartment and one cellar in the same transaction.
Transactions 2014 To 2020
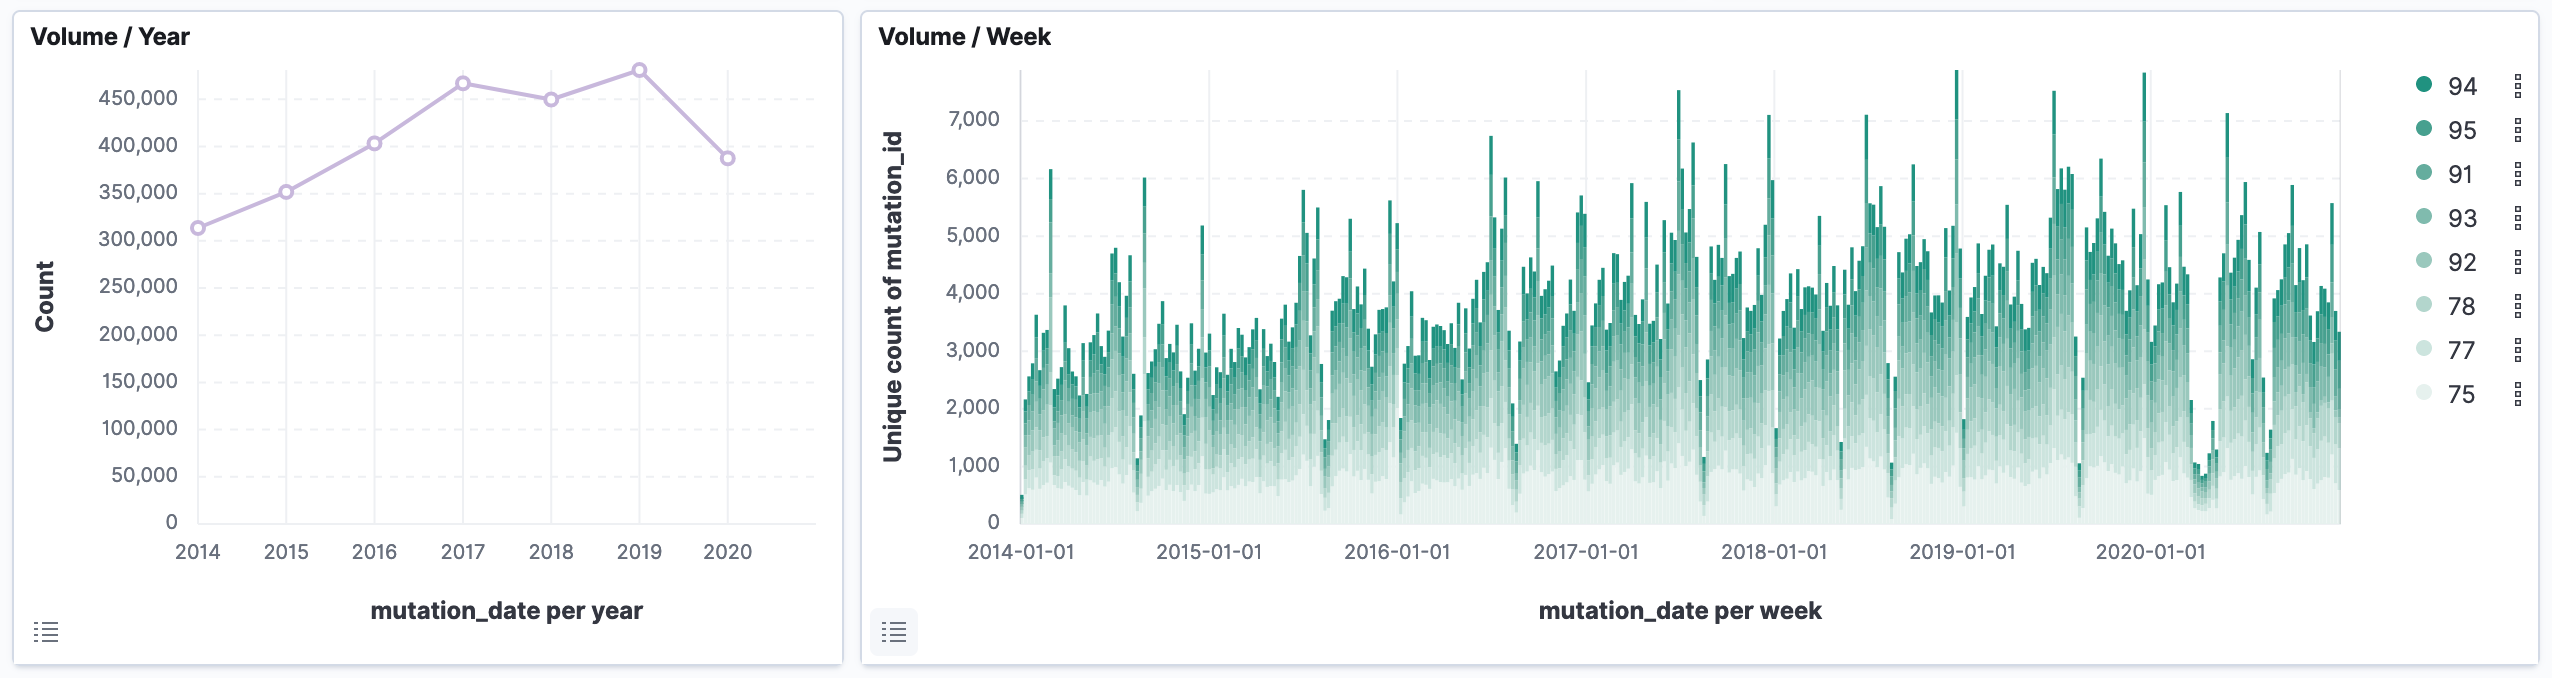
If we compare to the previous years, we can see that the market was impacted by the COVID-19 in 2020. The total number of mutations decreased 19.5% (481,002 in 2019 vs 387,425 in 2020) in Île-de-France. Some contributing factors may be the COVID-19 measures taken by the government (lockdown, curfew), the economic impact (partial unemployment, complete unemployment), the psychological factor (uncertainty about the future).
Before going further, let’s spend some time understanding which part of the dataset is the most valuable for the analysis. To do that, we can aggregate the data per field and continue our study on the most significant ones. Here I chose the field “nature of mutation” and the field “premise type”.
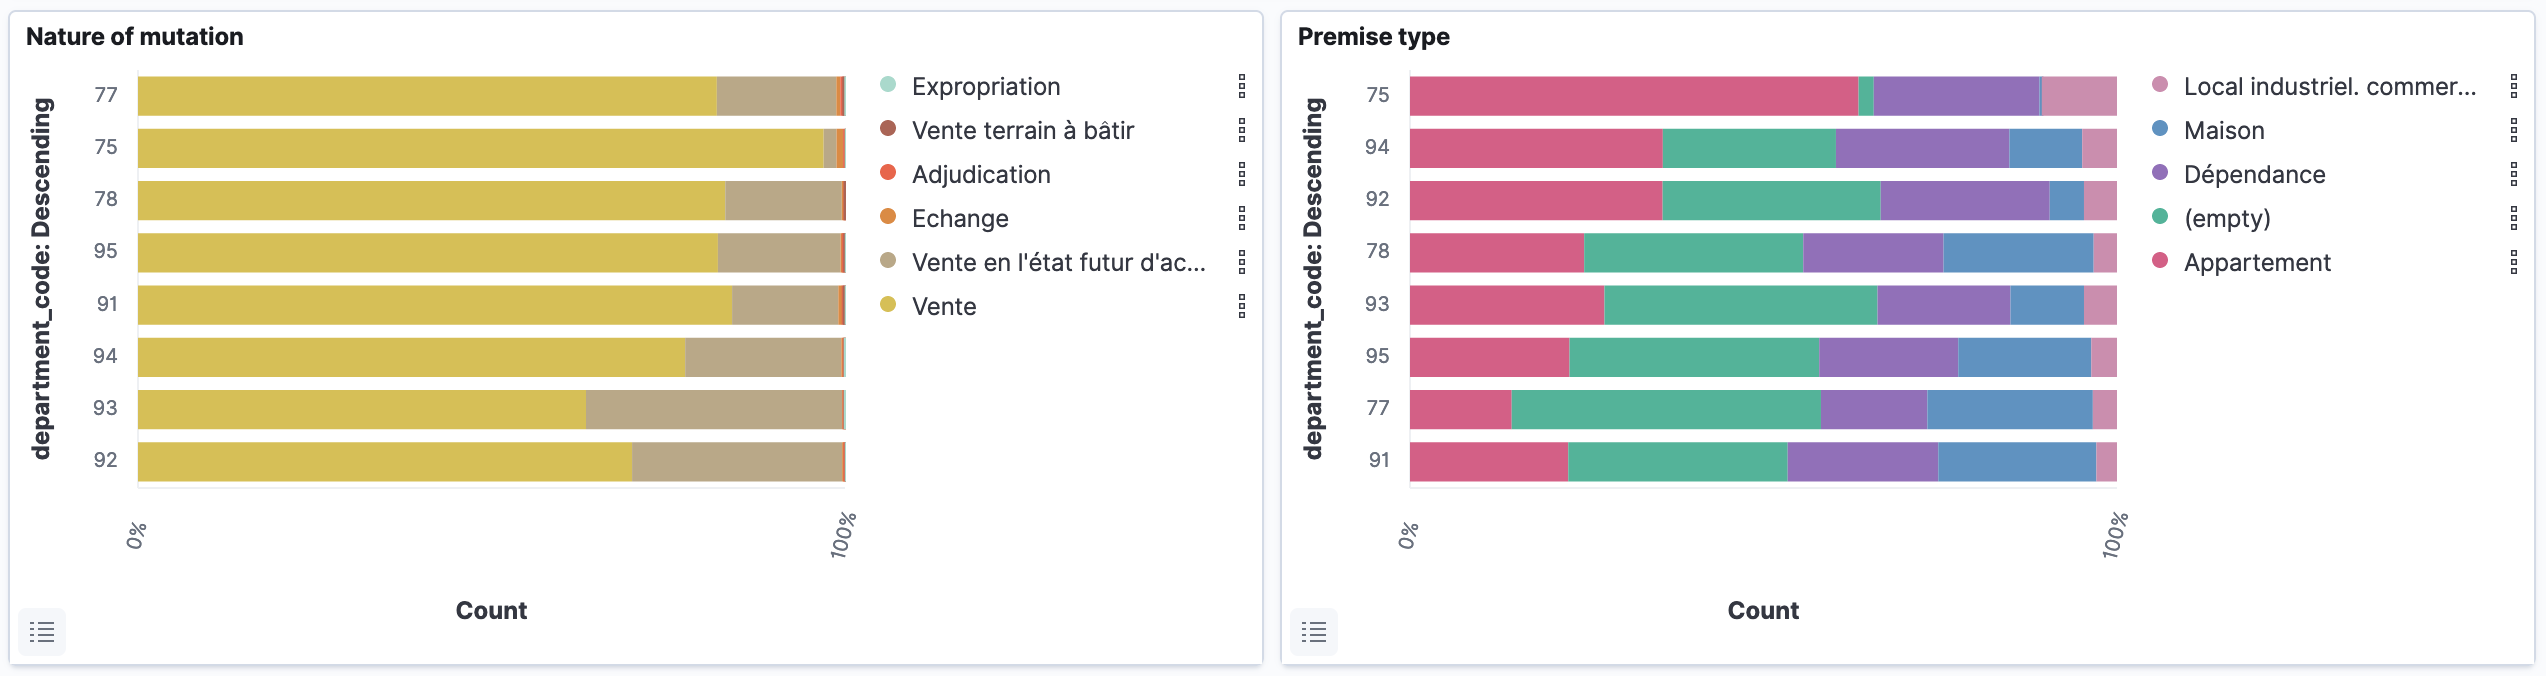
Nature of mutation. From the widget on the left side, you can see that there are several reasons why people make a transaction: expropriation, vente terrain à bâtir (building plot for sales), adjudication (judgement), échange (exchange), vente (sales), and vente en l’état future d’achèvement” (sales before completion). Most of the time it’s either “Vente” or “Vente en l’état future d’achèvement”. That’s why I am going to focus my analysis on these two types in the following sections.
Premise type. From the widget on the right side, you can see the different types of premises that people sell: local industriel, commercial ou assimilé (industrial, commercial or related premise), maison (house), dépendance (dependent), appartement (apartment), or empty. For those mutations having an empty type, they can be meadows, lands, gardins, thickets, etc that we love but we don’t have time to cover in this article. As for the “dependent” ones, they depend on the main types: apartment, house, … where these mutations happen in the same transaction. For example, a dependent can be a cellar. When someone buys an apartment, he/she buys the cellar at the same time. So I am going to filter them out as well.
In short, we are going to look into the sales of apartments and houses in the next sections.
Apartment And House
Map
If we put all the sales of apartments and houses (first-hand and second-hand combined) into a map, we can obtain the following result:
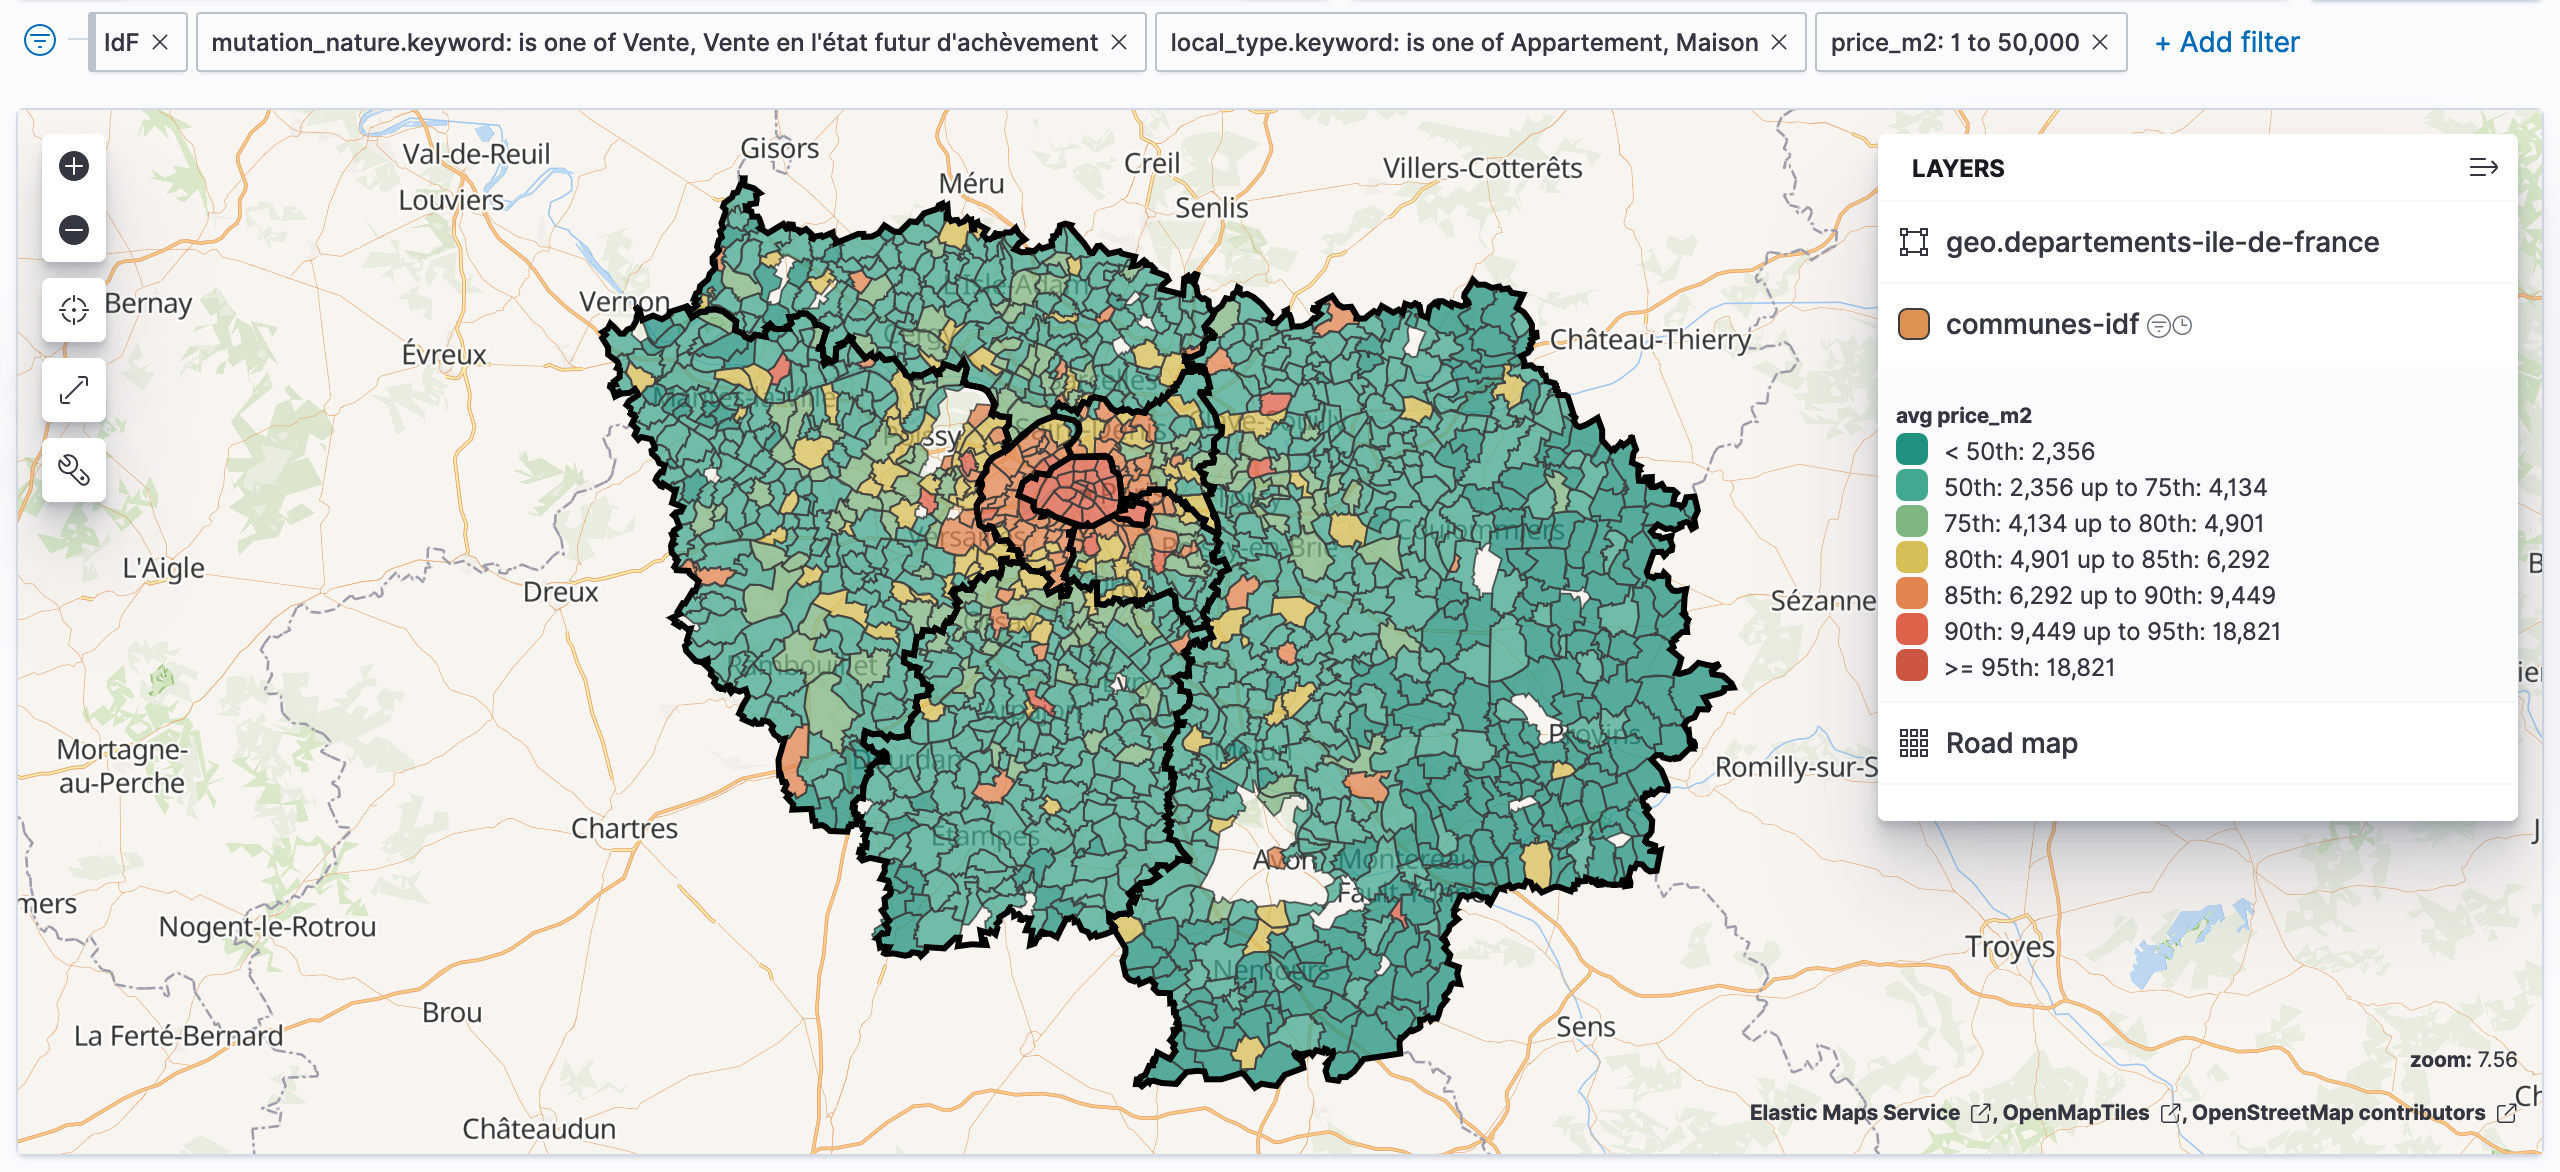
This map is aggregated by the municipality (commune). The color represents the average price per meter square (€/m2) of the municipality. You can see that the most expensive ones are all located in Paris (75) in the middle of the map with an average price higher than 9,449 €/m2. Other municipalities around Paris are also expensive, especially on the west side. These departements around Paris are called “La Petite Couronne” (The . It consists of three departments: les Hauts-de-Seine (92), la Seine-Saint-Denis (93), and le Val-de-Marne (94).
First-Hand vs Second-Hand
If we split the market into first-hand and second-hand, you can see that they are actually quite different. In the widgets below, we compare the first-hand market and second-hard market for their volume in 2020. The first one is for the entire Île-de-France and the second one is aggregated by the department.
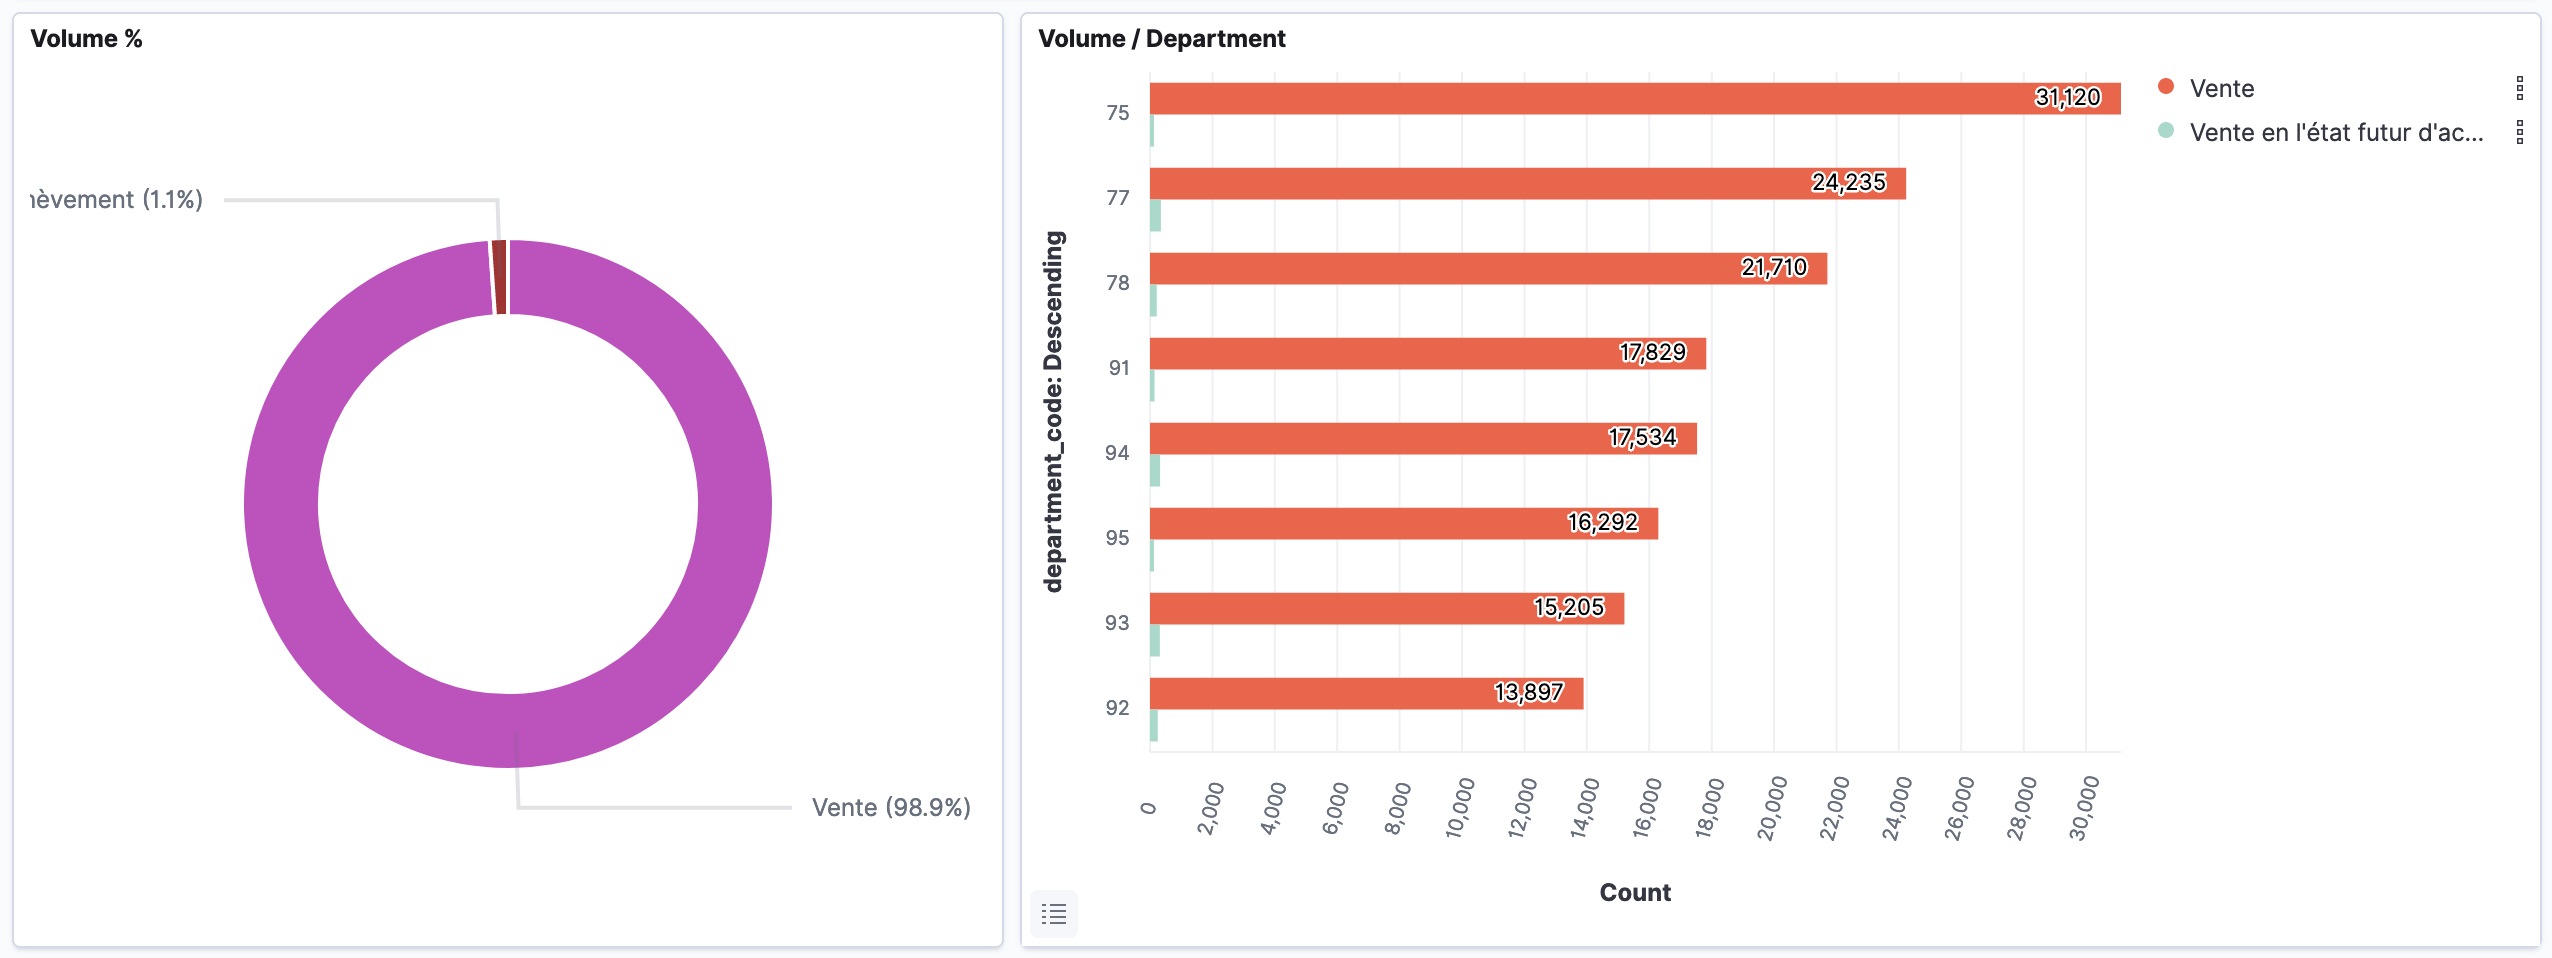
For the entire Île-de-France, the first-hand apartments and houses represent about 1.1% of the total mutations and the second-hand ones represent 98.9%. On the right side, you can see the actual volume of each department. The first series (red) is for second-hand transactions and the second series (green) is for first-hand transactions. As you can see, second-hand transactions represent 99.9% of the transactions in Paris (75). In other departments, second-hand transactions represent about 98.5% of the market. I believe that this ratio is probably related to COVID-19 because historically speaking, the ratio of second-hand transactions is about 93% (2014 to 2019).
Second-Hand
Now, what if we focus on the second-hand market?
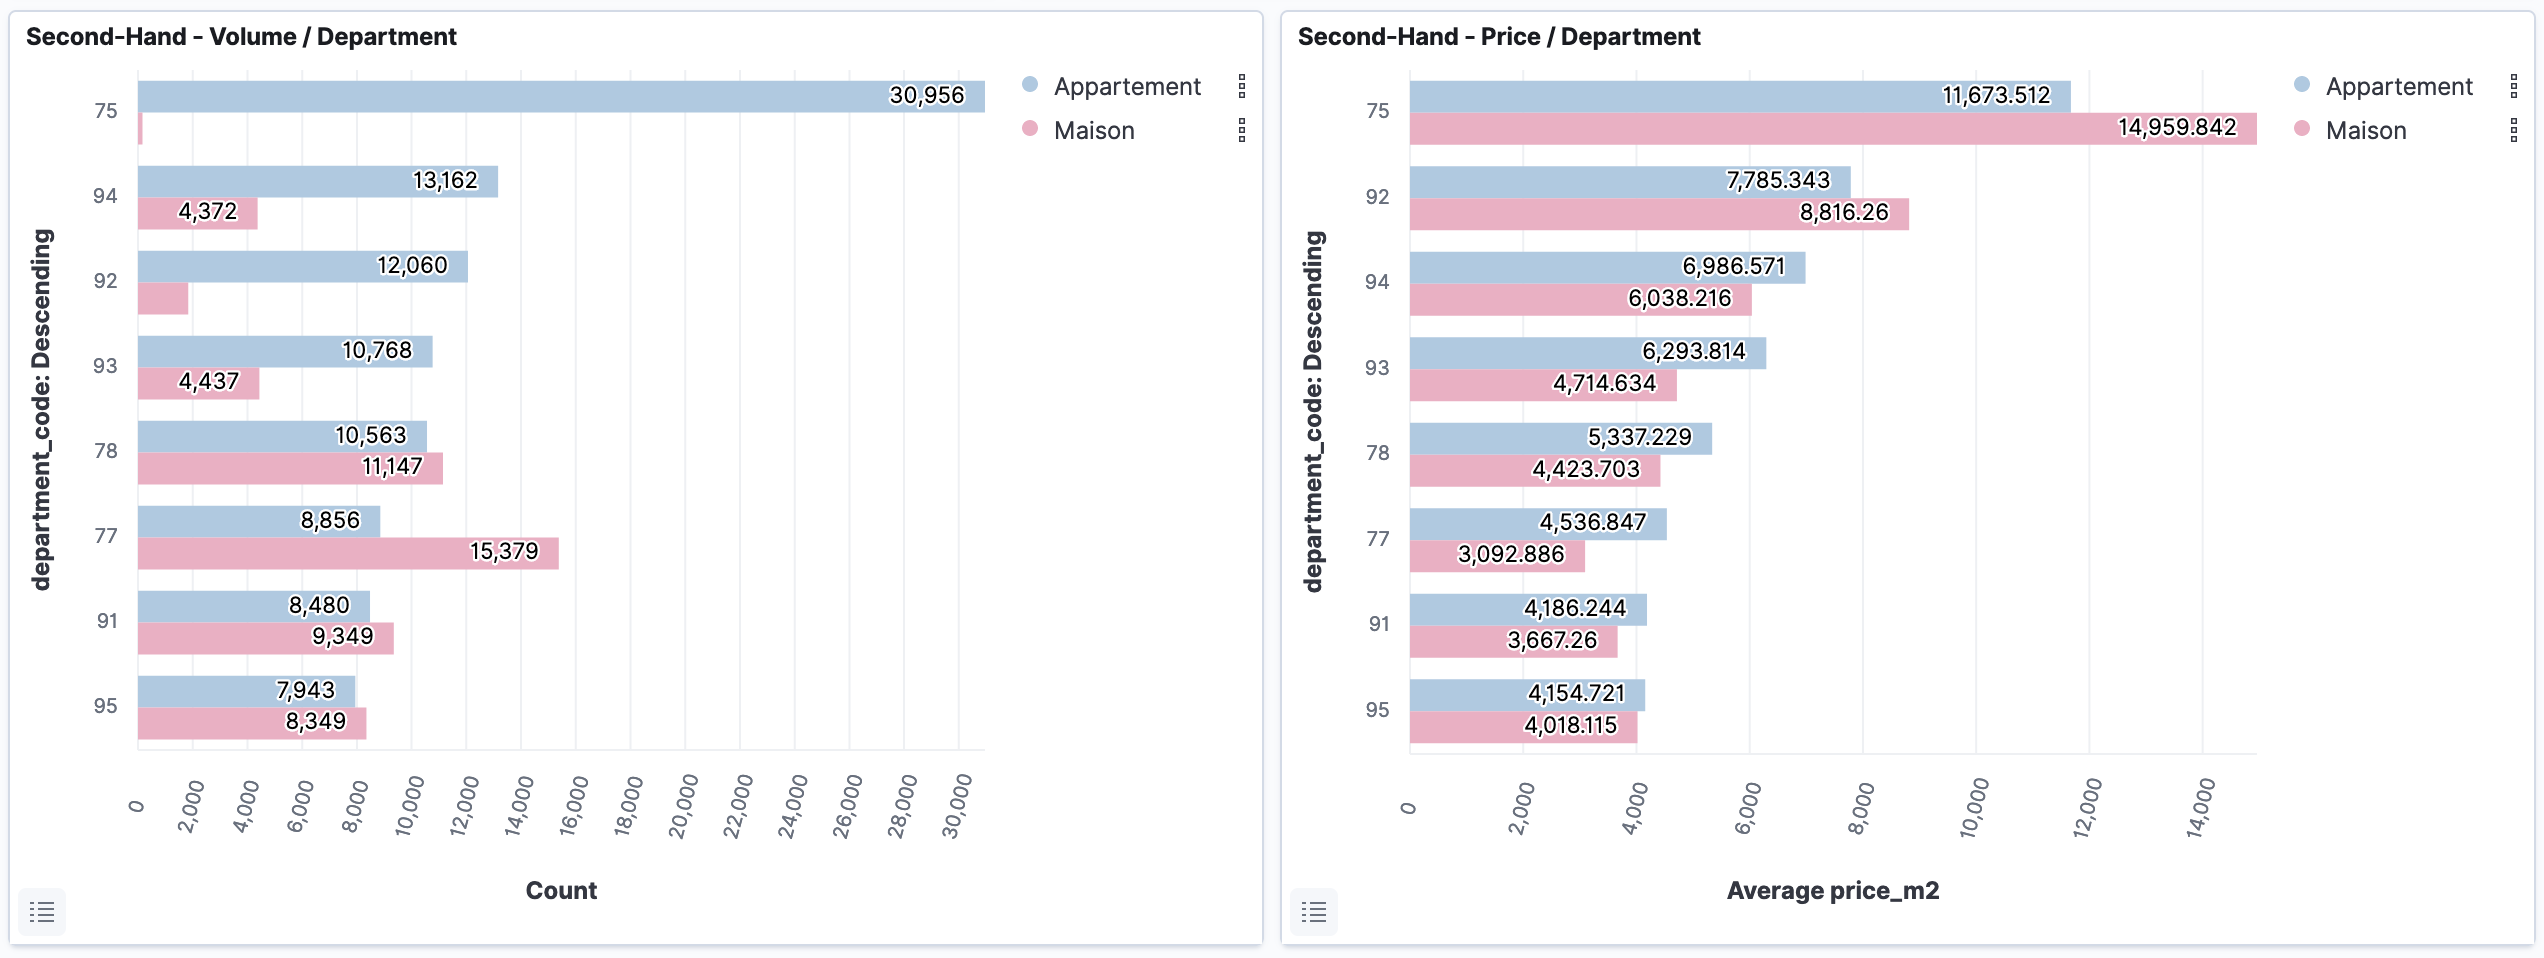
If we focus on the second-hand market, we can see that there is almost no house to sell in Paris (75). The entire market is filled with apartments (30,956 mutations). If you want to buy a house, you probably need to go to the petite gouronne (92, 93, 94) or the grande gouronne (77, 78, 91, 95). They have more offers. As for the price, Paris (75) is still the champion with an average of 11,673 €/m2 for houses and 14,959 €/m2 for the apartments. Les Hauts-de-Seine (92), le Val-de-Marne (94), and la Seine-Saint-Denis (93) follow Paris (75) and take the top 4.
We are reaching the end of this section. In this section, we compared the apartments and houses in Île-de-France. We compared the type of sales, the volume, and the price in different departments. In the next section, we are going to explore the market of second-hand apartments.
Second-Hand Apartments
Price
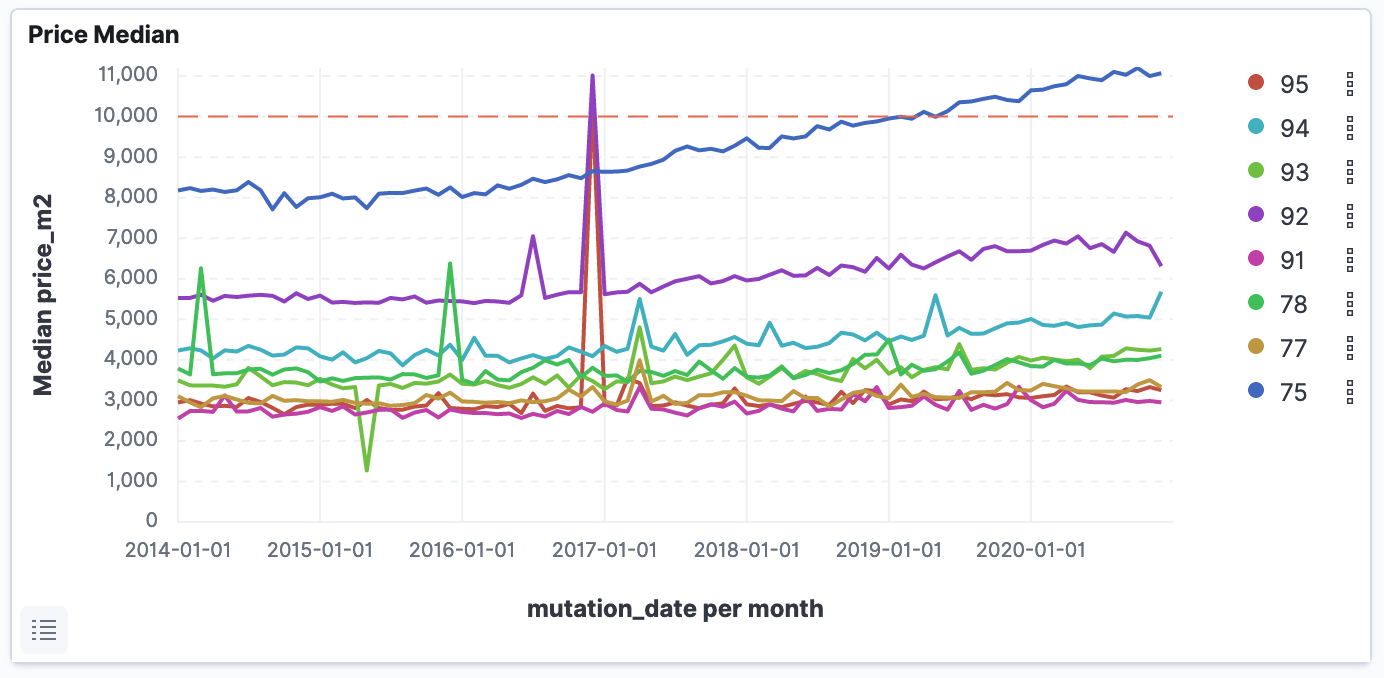
First of all, let’s take a look at the price. As you can see in the graph above, the median price of Paris is significantly higher than other departments and the trend continues in 2020 despite the global pandemic. The podium didn’t change in 2020: les Hauts-de-Seine (92) is still in the 2nd position and followed by le Val-de-Marne (94) at the 3rd position. However, the price of les Hauts-de-Seine (92) dropped significantly alongside with la Seine-et-Marne (77). If you want to have a more detailed version of the trends displayed above, here a table of comparison for you. In this table, there is the median price of the second-hand apartment for each department in 2015 (5 years ago), 2019 (1 year ago), and 2020. It allows you to better follow the department that matches your interest.
Table: Median Price of the second-hand apartments in Île-de-France
| Department | 2015 (€/m2) | 5y Diff | 2019 (€/m2) | 1y Diff | 2020 (€/m2) |
|---|---|---|---|---|---|
| 75 - Paris | 8,098 | +35.0% | 10,218 | +7.0% | 10,933 |
| 92 - Hauts-de-Seine | 5,463 | +25.6% | 6,536 | +5.0% | 6,860 |
| 93 - Seine-Saint-Denis | 3,266 | +25.2% | 3,848 | +6.3% | 4,089 |
| 94 - Val-de-Marne | 4,122 | +21.5% | 4,733 | +5.8% | 5,009 |
| 77 - Seine-et-Marne | 2,989 | +10.3% | 3,176 | +3.8% | 3,296 |
| 78 - Yvelines | 3,685 | +7.6% | 3,899 | +1.5% | 3,956 |
| 91 - Essonne | 2,729 | +8.7% | 2,946 | +0.5% | 2,960 |
| 95 - Val-d’Oise | 2,877 | +10.7% | 3,071 | +3.7% | 3,184 |
Pieces
Another important factor to take into account is the number of pieces. A single person, a young couple, a family with 2 children, … they probably don’t have the same needs. That’s why I want to study the number of pieces so that you can find out what matches you most. Here is the distribution of the transactions grouped by the number of pieces. The first one is for the entire Île-de-France and the second one is aggregated by department:
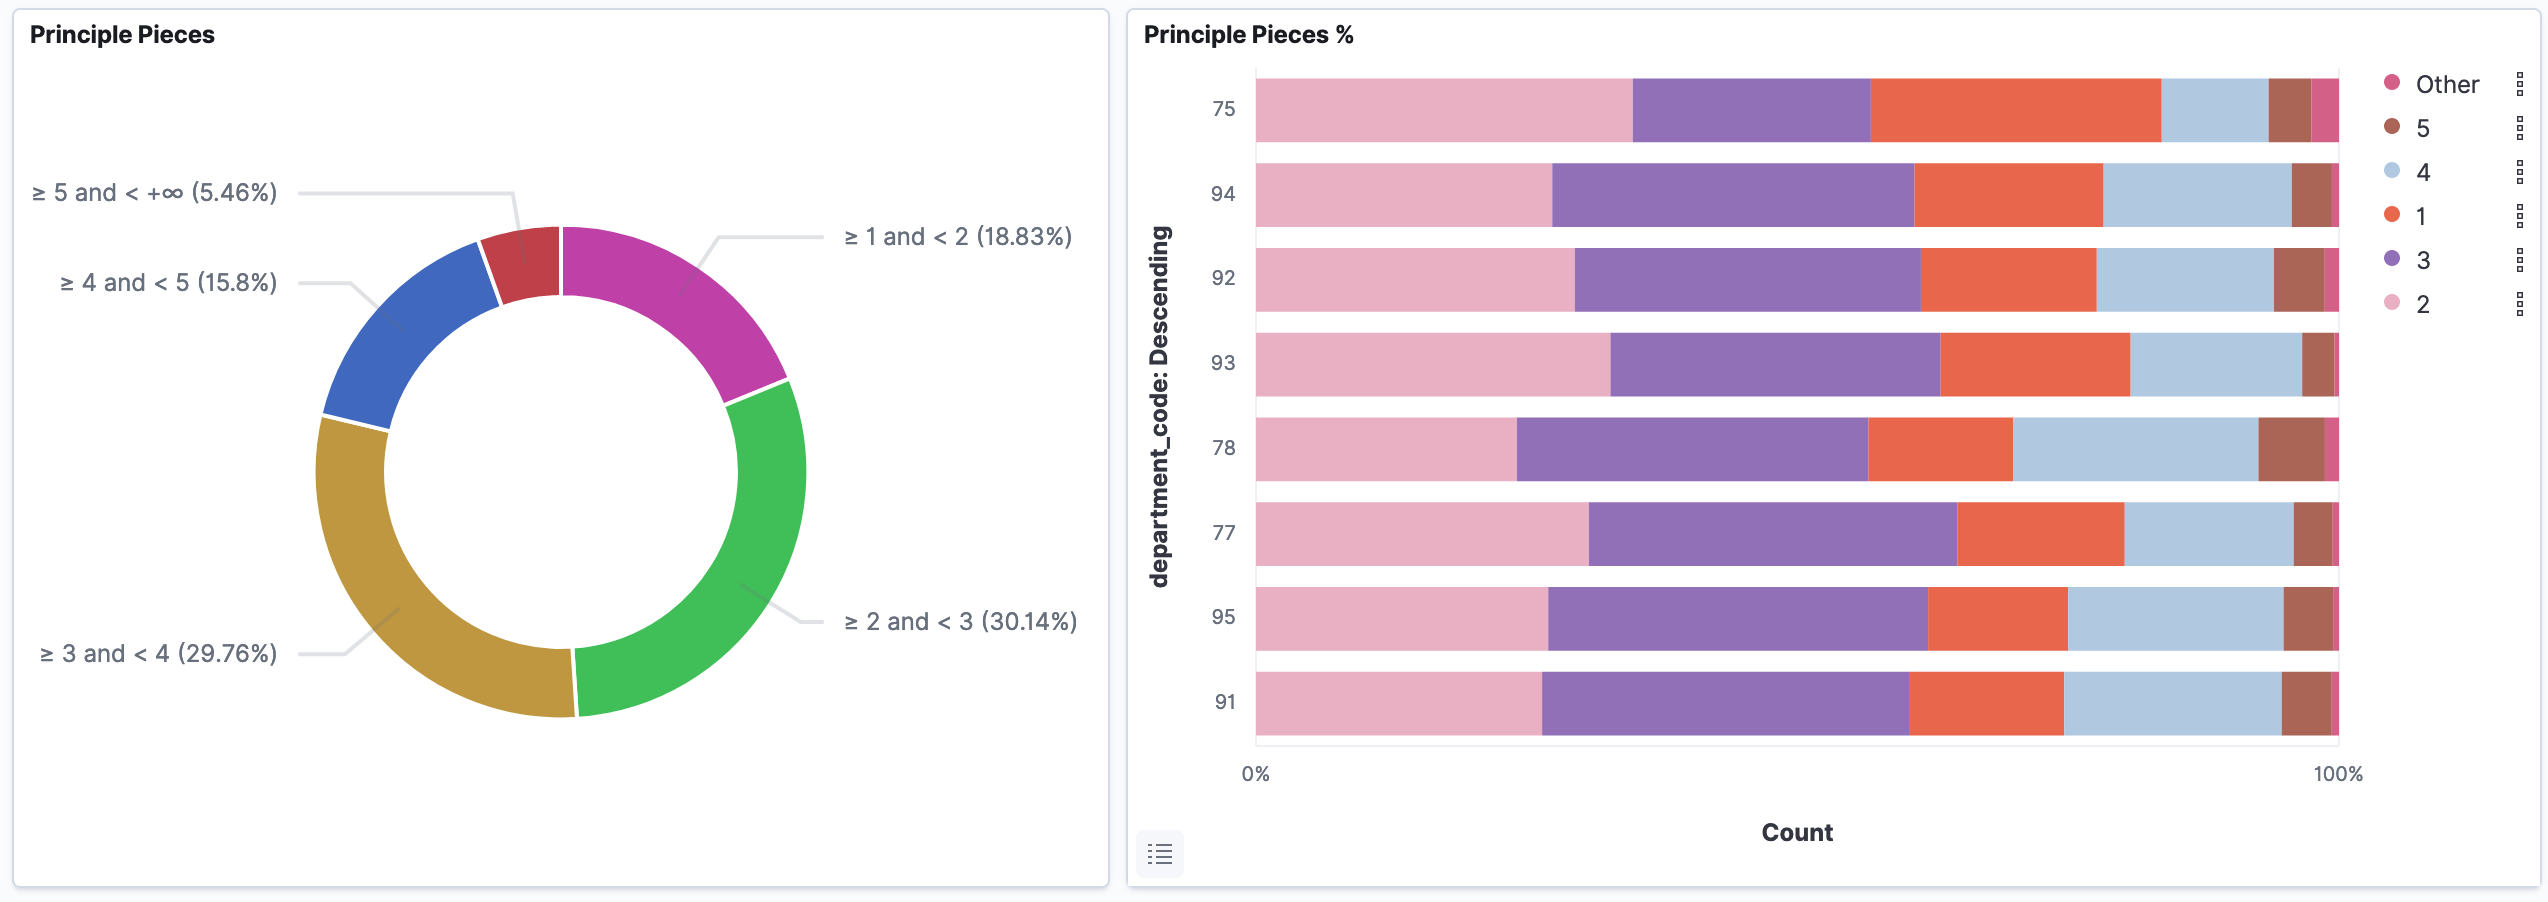
On the widget on the right side, the percentage is not shown in order. The displayed order is 2, 5, 1, 3, and other. This is because the term having the highest percentage has to be placed first in Kibana.
You can see that T1 and T2 represent about half of the offers in the market of the second-hand apartments. T3 and T4 represent almost the other half. There are only a few apartments having more than 4 pieces, maybe because people prefer houses over apartments when they need more rooms.
Budget
We talked about the price per meter square (€/m2) and the number of pieces inside an apartment. But we didn’t talk about the total price — how many budgets do you have? Are you ready to spend that amount of money or make a mortgage? To let you better understand the situation, I prepared another widget. It tells you what you can buy with a given range of budget (200K€, 400K€, 600K€, 800K€):
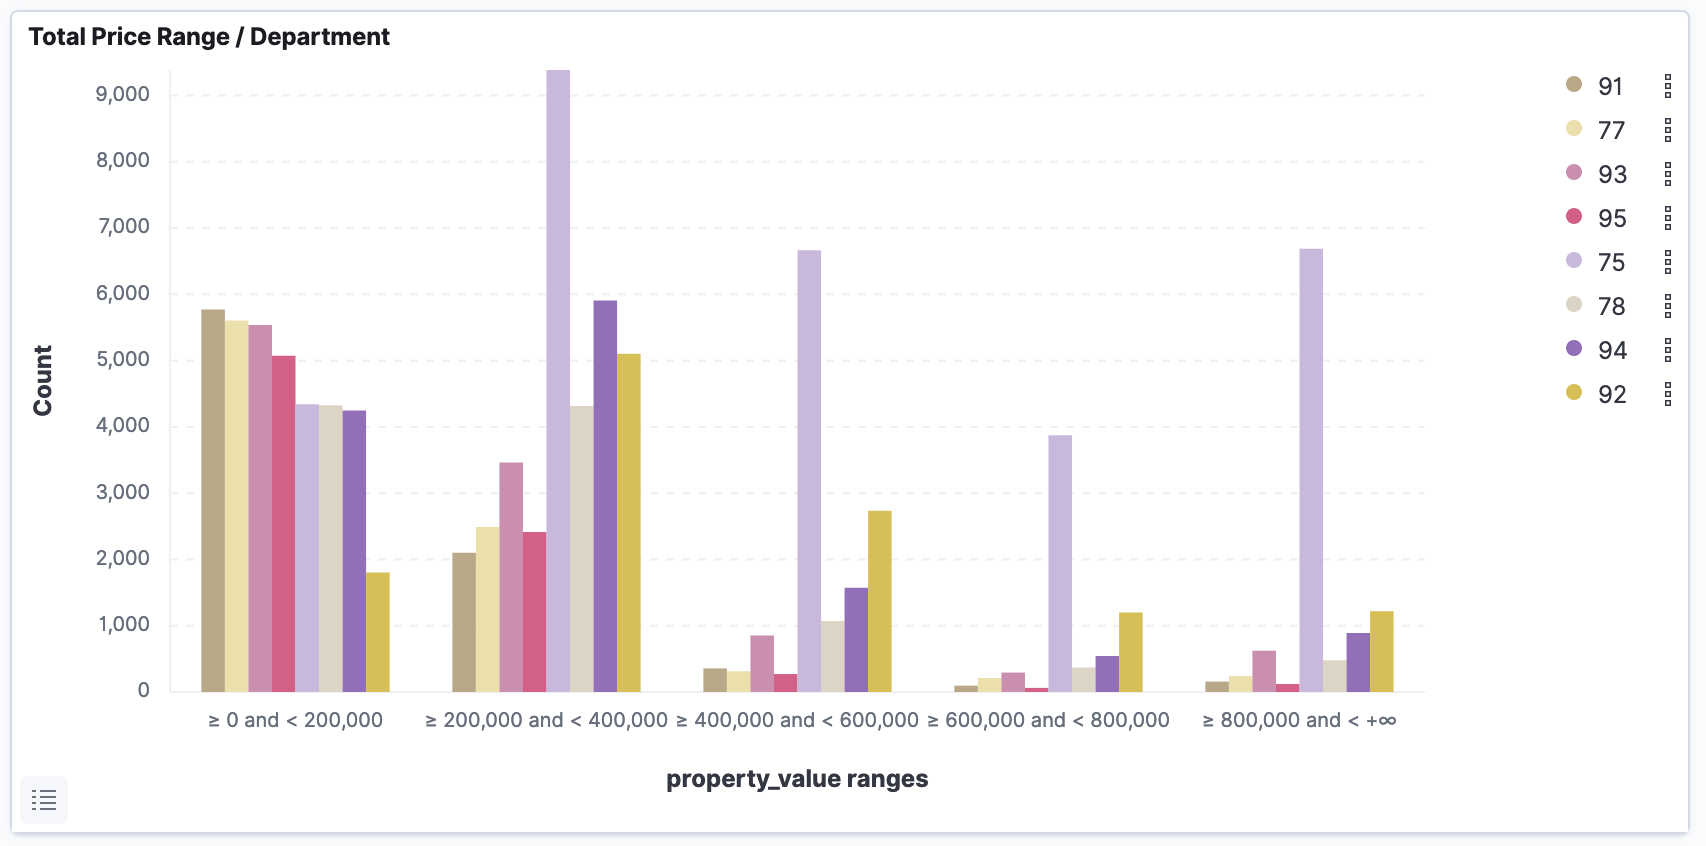
The color is not great but I don’t have time to make it better. I hope that it won’t bother you too much.
From the widget above, we can find interesting information:
- If you have 200K€, you have a wide range of choices across all the departments. You can buy an apartment at a reasonable price. It may not be the best apartment that you want, but buying it will allow you to start having your own property and stop wasting money on the apartment rent. Based on the salary in Île-de-France and the constraint about the loan (up to 33% net income), I think 200K€ is an important amount. Note that the choices are much less for les Hauts-de-Seine (92) compared to other departments.
- If you have 400K€, e.g. you are buying an apartment with your partner, you can see that the range of choices is even larger. You should be able to find something that fits your needs in each department.
- For 400K€+, you can see that Paris (75) still has a lot of apartments that are located in these ranges. They are super expensive. The buyers are probably not normal residents but rather some real-estate investors (person or company) or rich people. According to the Notary of France (Notaires de France), the number of investors coming from foreign countries is not negligible. However, the number reduced in 2020 and reached its lowest level. For example, in the 6th district of Paris, the number reduced from 17% in 2015 to 9.4% in Q3 2020 (article link).
Going Further
How to go further from here?
- To learn more about Kibana, visit Elastic’s official website https://www.elastic.co/kibana/
- To learn more about Elasticsearch, visit Elastic’s official website https://www.elastic.co/elasticsearch/
- To learn more about how to use Elasticsearch for DVF, you can visit my previous articles of this series “DVF”
- To see the source code about this DVF project, you can visit my GitHub repository mincong-h/learning-elasticsearch, the source code is under the directory “demo-dvf”.
Conclusion
In this article, we analyzed the real estate market of Île-de-France in 2020. We started from the global landscape and ended with a more focused analysis on the market of second-hand apartments. We saw the market was active in 2020 despite the pandemic. The period of March to May 2020 was difficult because of the lockdown. We saw that the number of sales-under-completion reduced significantly in 2020 compared to last years (1% vs 7%). As for apartments, les Hauts-de-Seine (92) was impacted by the pandemic as the median price dropped at the end of 2020. On the other hand, the situation is more optimistic for Paris (75): the median price of second-hand apartments in Paris (75) increased 35.0% in 5 years and the growth continued (7.0%) in 2020. We also saw that the 400K€ is maybe enough for the greater Paris area, but not for Paris (75). Interested to know more? Please subscribe to the feed of my blog, follow me on Twitter or GitHub. This will really motivate me to write more. Hope you enjoy this article, see you the next time!
TODO
What to do the next time?
I did this analysis for fun during my holidays and I spent 3 days on it. The main issues were that the data preparation was very long and this is the first time I used Kibana. Because of my limited number of day-offs, I don’t have more time spent on it. If I can do that again in the future, here are some ideas of improvements:
- Going further in the one department, e.g. Paris (75) because real estate is highly related to geography, it does not have much added value if we only stay in a high-level overview.
- Perform a prediction-related widget to forecast the trend of a given metric.
- Create a widget using a time-based comparison (e.g. comparing the same period last year)
- Annotate some widgets to better fit the analysis.
… and you, do you have suggestions for improvements or what do you want to know more about? Please let me know by leaving a comment 🙏
References
- Grégoire David, “France GeoJSON”, github.com, 2018. https://github.com/gregoiredavid/france-geojson
- Notaires de France, “Marché immobilier : tendance et évolution des prix de l’immobilier”, notaires.fr, 2021. https://www.notaires.fr/fr/immobilier-fiscalit%C3%A9/prix-et-tendances-de-limmobilier/analyse-du-march%C3%A9-immobilier
- PwC, “Emerging Trends in Real Estate - United States and Canada 2019”, PwC, 2019. https://www.pwc.com/jg/en/publications/etre_us_2019_report.pdf
- Jingwen Zheng, “Second-hand apartments transactions in Île-de-France (01/2014 - 06/2020)”, jingwen-z.github.io, 2021. https://jingwen-z.github.io/second-hand-apartments-transactions-in-idf-1420/