Introduction
Recently I was developing a search solution for my blog to improve the search experience, based on Java and Elasticsearch. Before using it in production, I want to set up a monitoring system to better understand what happens. As a Datadog employee, I naturally chose Datadog as the solution because I have been using it for several years now. This article mainly explains how I set up the whole system. Hopefully, it will be useful for you as well. Please note that this is NOT an official guide from Datadog. It’s simply a side project that I did in my free time.
Currently, I am running my project in Alibaba Cloud inside a Linux server (Ubuntu), inside which there are mainly two Docker containers: one for the Java application for search and the other for Elasticsearch. After reading this article, you will understand:
- How to integrate Alibaba Cloud?
- How to set up Datadog Agent in Docker mode?
- How to integrate Elasticsearch?
- How to integrate a Java application (logs)?
- How to enable APM?
- How to enable profiling?
This article does not aim to be exhaustive. Instead, it provides a high-level overview and tries to give you a big picture. Now, let’s get started!
Prerequisite
Before adding integrations, the first step is to sign up for a trial account in Datadog so that you can create credentials (API, APP keys) for the integrations, and also have the detailed instructions for different integrations inside Datadog’s Web Application. Compared to the static documentation, the hints and commands there are more adapted to your need, where API key is prefilled and the Datadog site (US, EU, …) is prefilled.
Integrate Alibaba Cloud
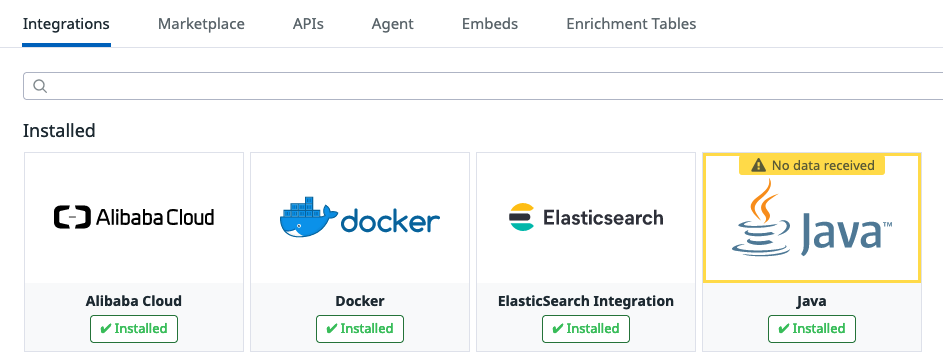
Datadog has documentation about Alibaba Cloud Integration and a blog post “Monitor Alibaba Cloud with Datadog” to help understand why the integration is beneficial for you. Following that documentation page will allow you to access metrics to different services, such as Alibaba Elastic Compute Service (ECS), Server Load Balancer (SLB), ApsaraDB RDS, ApsaraDB for Redis, Content Delivery Network (CDN), Container Service, Express Connect.
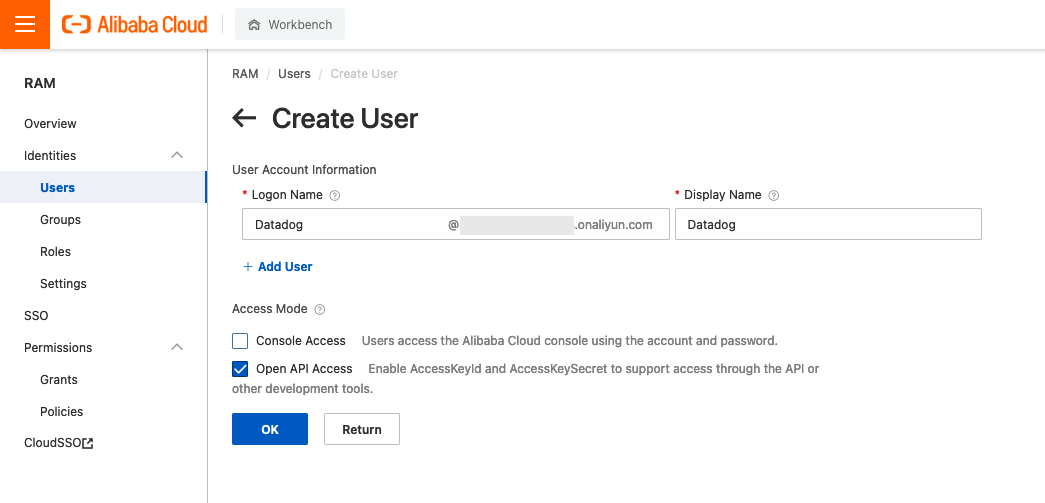
Setting up the integration is pretty simple, you need to:
- In Alibaba Cloud, create a service account in Resource Access Management (RAM) to provide programmatic access for Datadog
- In Alibaba Cloud, grant permissions for resources that you want to monitor
- In Datadog, provide the access key and secret generated previously so that Datadog can crawl those metrics.
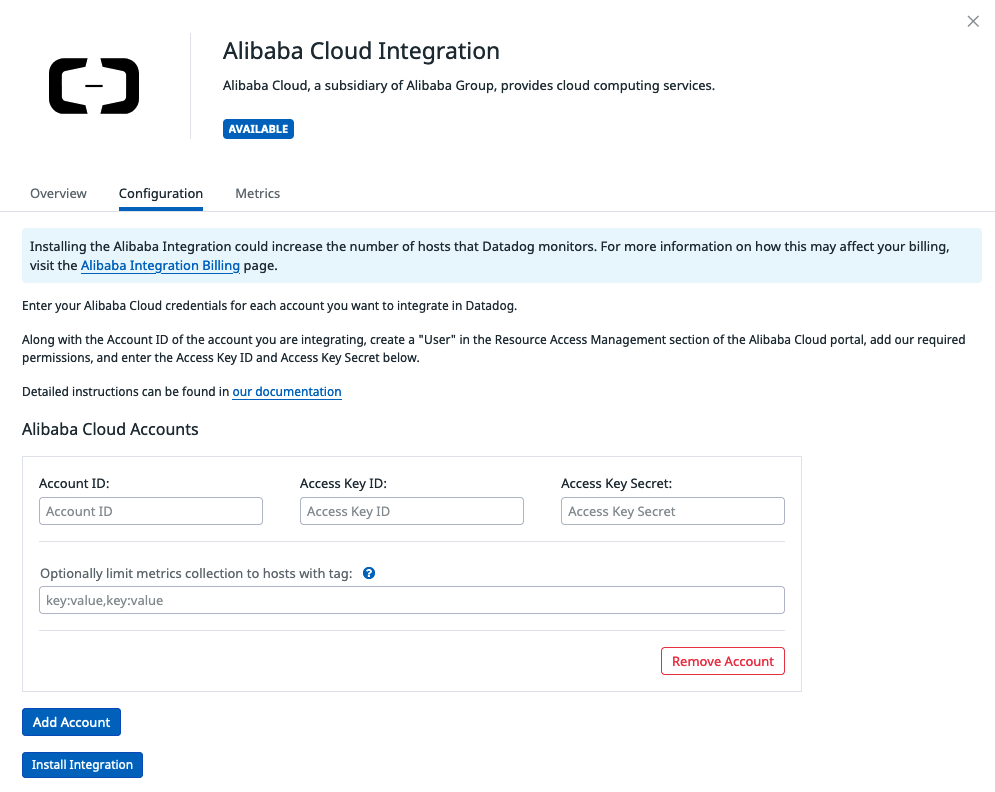
Note that installing the Alibaba Integration could increase the number of hosts that Datadog monitors. For more information on how this may affect your billing, visit the Alibaba Integration Billing page. In my case, it does not impact me because I have one single host – having this integration won’t add more hosts to the bill.
Set Up Datadog Agent
The previous section focus on the cloud provider level. And now it’s time to go further into the host level. Since I am running two services, my Java app and Elasticsearch, in Docker, I believe that there are two options to monitor them: using either the Datadog agent at the host level or as a Docker container.
- Host level. The Datadog Agent is installed via
aptand running withsystemd - Docker level. The Datadog Agent is installed via Docker and running as a Docker container
In the beginning, I chose the first option because I imagine that it can
capture more information about the host such as the Linux Kernel, disk, systemd,
etc. Also because I can configure the agent easily (through the files inside
/etc/datadog-agent/conf.d/). However, it didn’t work as expected. It failed to
monitor Docker since the
socket is hard-coded to unix:///var/run/docker.sock, but my Docker engine did
not use that endpoint. It is using unix:///run/user/1000/docker.sock since I
am running Docker in rootless mode (see
“Run the Docker daemon as a non-root user (Rootless
mode)”). I kept seeing
errors:
2022-03-26 15:36:24 CST | CORE | ERROR | (pkg/collector/worker/check_logger.go:68 in Error) | check:docker | Error running check: temporary failure in dockerutil, will retry later: Got permission denied while trying to connect to the Docker daemon socket at unix:///var/run/docker.sock: Get “http://%2Fvar%2Frun%2Fdocker.sock/v1.24/info”: dial unix /var/run/docker.sock: connect: permission denied
By consequence, I fell back to the second option, where I started Datadog agent in Docker mode. Here is the command I used for starting the Docker container:
docker run -d --name datadog-agent \
    -e DD_API_KEY=<DD_API_KEY> \
    -e DD_LOGS_ENABLED=true \
    -e DD_LOGS_CONFIG_CONTAINER_COLLECT_ALL=true \
    -e DD_SITE="datadoghq.eu"  \
    -v /run/user/1000/docker.sock:/var/run/docker.sock:ro \
    -v /proc/:/host/proc/:ro \
    -v /opt/datadog-agent/run:/opt/datadog-agent/run:rw \
    -v /sys/fs/cgroup/:/host/sys/fs/cgroup:ro \
    datadog/agent:7
And here is the explanation of these options:
| Option | Description |
|---|---|
-e DD_API_KEY |
This environment variable specifies the API key of Datadog. |
-e DD_LOGS_ENABLED |
This environment variable indicates that the logs integration is enabled. |
-e DD_LOGS_CONFIG_CONTAINER_COLLECT_ALL |
This environment variable adds a log configuration that enables log collection for all containers. |
-e DD_SITE |
This environment variable is used to ask the agent to send data to the EU site. |
-v /run/user/1000/docker.sock:/var/run/docker.sock:ro |
This option binds the Docker socket /run/user/1000/docker.sock to containers’ /var/run/docker.sock so that Datadog agent can monitor the Docker engine. |
-v /proc/:/host/proc/:ro |
This option gives Datadog agent read-only access to some kernel data and system information. See this article “procfs” to learn more about the proc filesystem. |
-v /opt/datadog-agent/run:/opt/datadog-agent/run:rw |
This option makes sure we do not lose any logs from containers during restarts or network issues, we store on the host the last line that was collected for each container in this directory. |
-v /sys/fs/cgroup/:/host/sys/fs/cgroup:ro |
This option gives Datadog agent read-only access to Linux control groups (cgroups). |
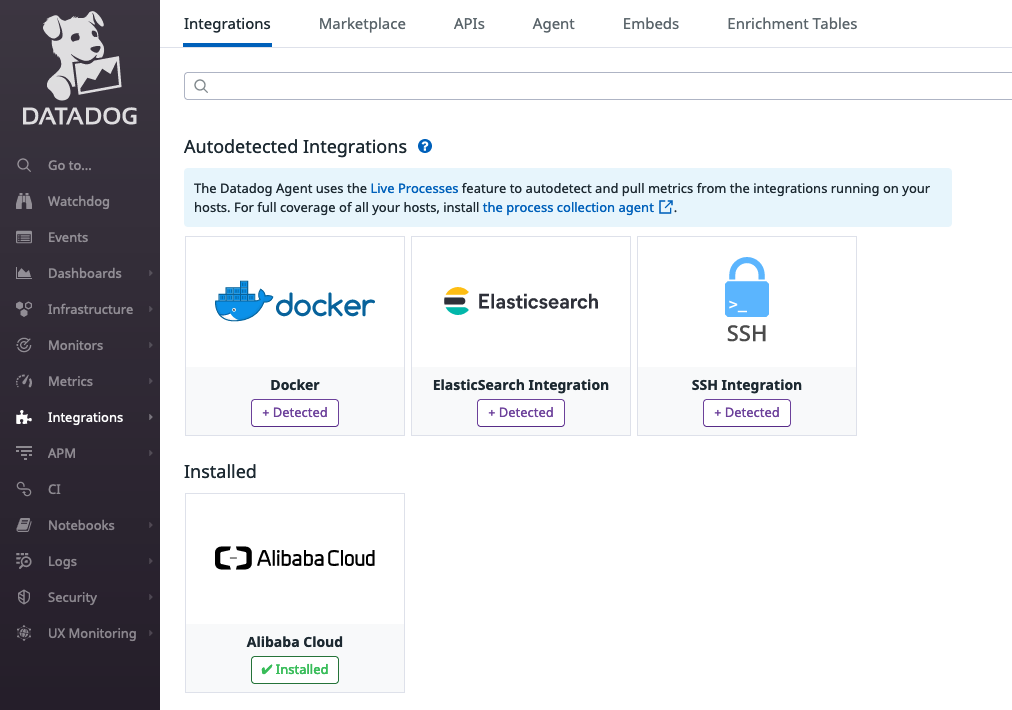
Once the Datadog agent is up and running, it can detect all the services running in the host and provide hints on the Datadog website. In my case, it detects 3 services: Docker, Elasticsearch, and SSH.
Autodiscovery
Now, it’s time to configure services correctly (Elasticsearch and my application
Java). The easiest way to do this is to rely on the
autodiscovery
mechanism provided by Datadog. With Autodiscovery, the Agent detects if it’s
running on Docker and automatically searches all labels for integration
templates. These labels can be defined in Dockerfile, docker-compose.yaml,
when running the Docker container (docker run), or inside Docker Swarm. You
can learn more about this in the article Docker Integrations
Autodiscovery.
We will see concrete examples in the sections below.
Integrate Elasticsearch
Integrating Elasticsearch can be zero-configuration as the integration is provided
out-of-the-box. As far as the Elasticsearch service is running on port 9200
(default), Datadog agent can detect it. In my case, it still requires some
configuration. This is because I followed Elasticsearch’s document to set up the
minimal security for
Elasticsearch.
In particular, it enables basic authentication for Elasticsearch. For Datadog
agent, it means providing a username and a password is required to
talk to Elasticsearch. In my case, I am using the remote_monitoring_user
as user and its password.
docker run \
  --detach \
  --env discovery.type=single-node \
  --label com.datadoghq.ad.check_names='["elastic"]' \
  --label com.datadoghq.ad.init_configs='[{}]' \
  --label com.datadoghq.ad.instances='[
      {
        "url": "http://%%host%%:9200",
        "username": "remote_monitoring_user",
        "password": "...",
        "auth_type": "basic",
        ...
      }
    ]' \
  --label com.datadoghq.ad.logs='[
      {
        "source": "elasticsearch",
        "service": "elasticsearch"
      }
    ]' \
  --network network-blogsearch \
  --publish 9200:9200 \
  --volume "/app/elasticsearch/data:/usr/share/elasticsearch/data" \
  --volume "/app/elasticsearch/config/elasticsearch.yml:/usr/share/elasticsearch/config/elasticsearch.yml" \
  --name "elasticsearch" \
  docker.elastic.co/elasticsearch/elasticsearch:7.16.3
As you can see, I used multiple labels for the Datadog autodiscovery (ad), for
the check, the configuration, and the logs integration. After restarting the
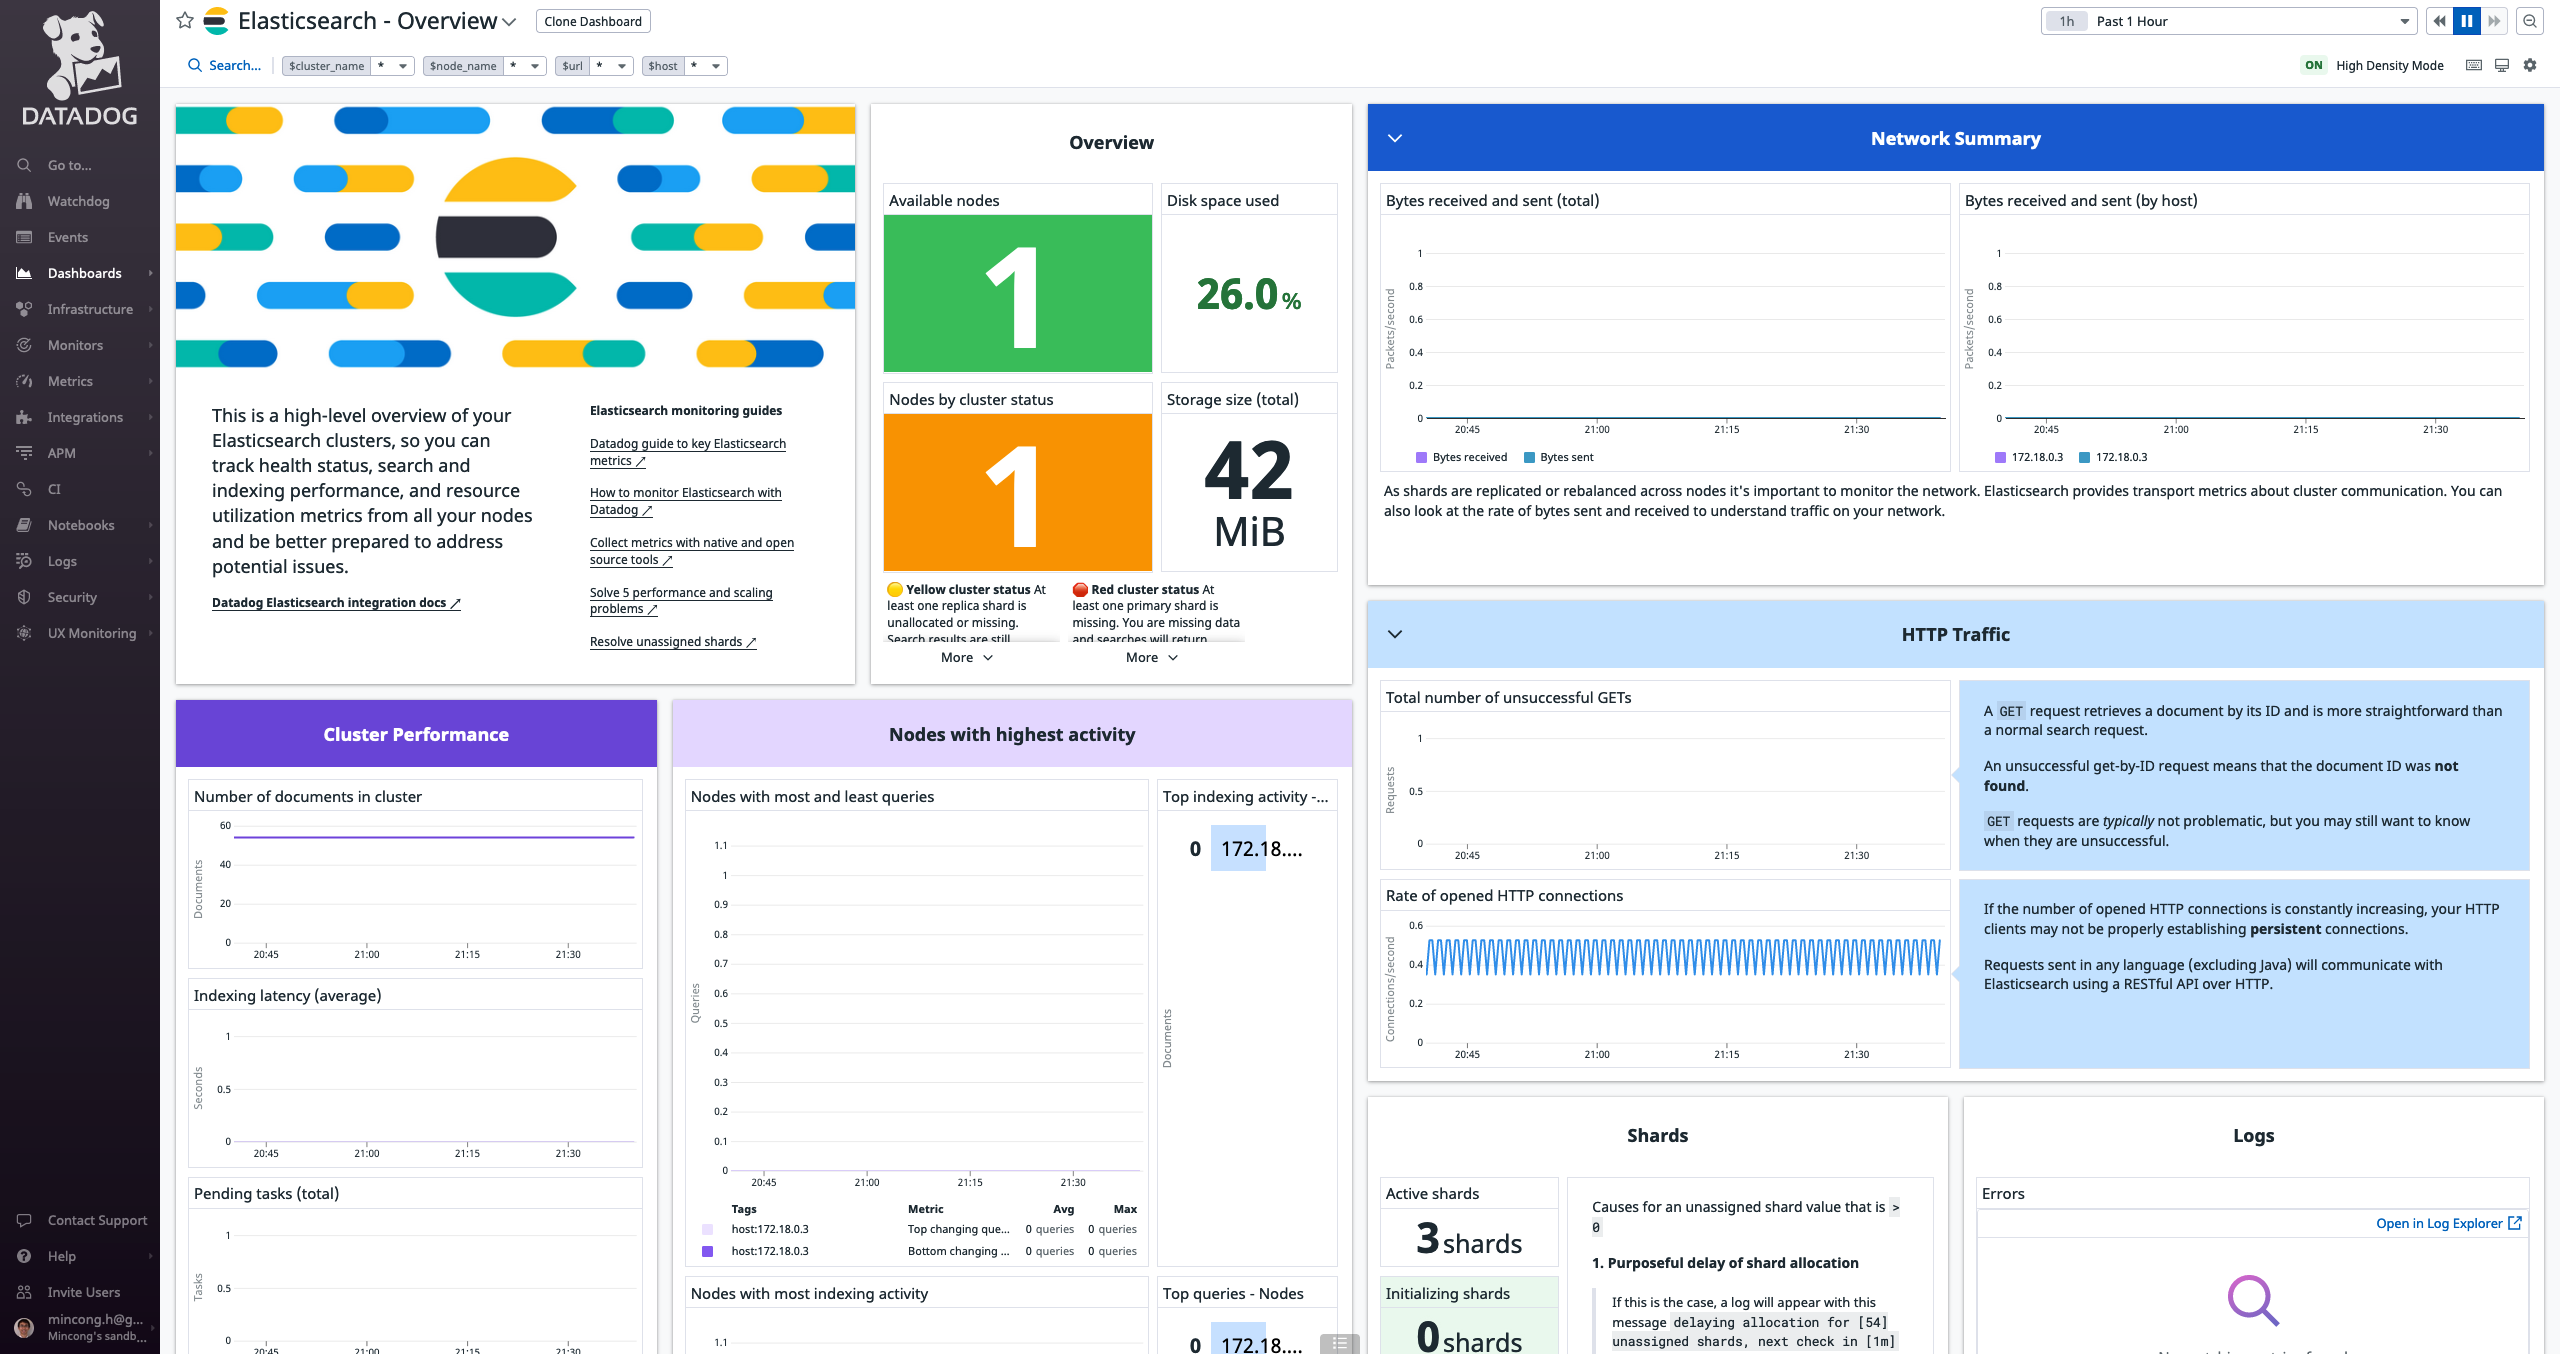
Elasticsearch container with these Datadog labels, Datadog agent was able to
configure everything. I saw the dashboard and logs in Datadog.
Integrate Java
Currently, my Java application does not have any custom metrics. So this section is focused on collecting logs. My application is built using Maven and Logback, so I am going to write how to configure them. Datadog has a page “Java Log Collection”, which explains how to configure logs under different logging frameworks (Log4j, Log4j2, and Logback), using JSON or raw format. In my case, I used JSON format as suggested by the documentation. As you may know, Logback does not have built-in support for JSON logging. So I used the logfellow/logstash-logback-encoder to provide the JSON logs, as suggested by the doc. This means declaring a dependency on the encoder and using it inside Logback’s file appender.
Dependency:
<dependency>
  <groupId>net.logstash.logback</groupId>
  <artifactId>logstash-logback-encoder</artifactId>
  <version>7.0.1</version>
</dependency>
Logback configuration (logback.xml):
<configuration>
  <appender name="CONSOLE" class="ch.qos.logback.core.ConsoleAppender">
    <encoder class="net.logstash.logback.encoder.LogstashEncoder"/>
  </appender>
  <appender name="FILE" class="ch.qos.logback.core.FileAppender">
    <file>/path/to/app.log</file>
    <encoder class="net.logstash.logback.encoder.LogstashEncoder"/>
    <!-- ... -->
  </appender>

  <root level="info">
    <appender-ref ref="CONSOLE"/>
    <appender-ref ref="FILE"/>
  </root>
</configuration>
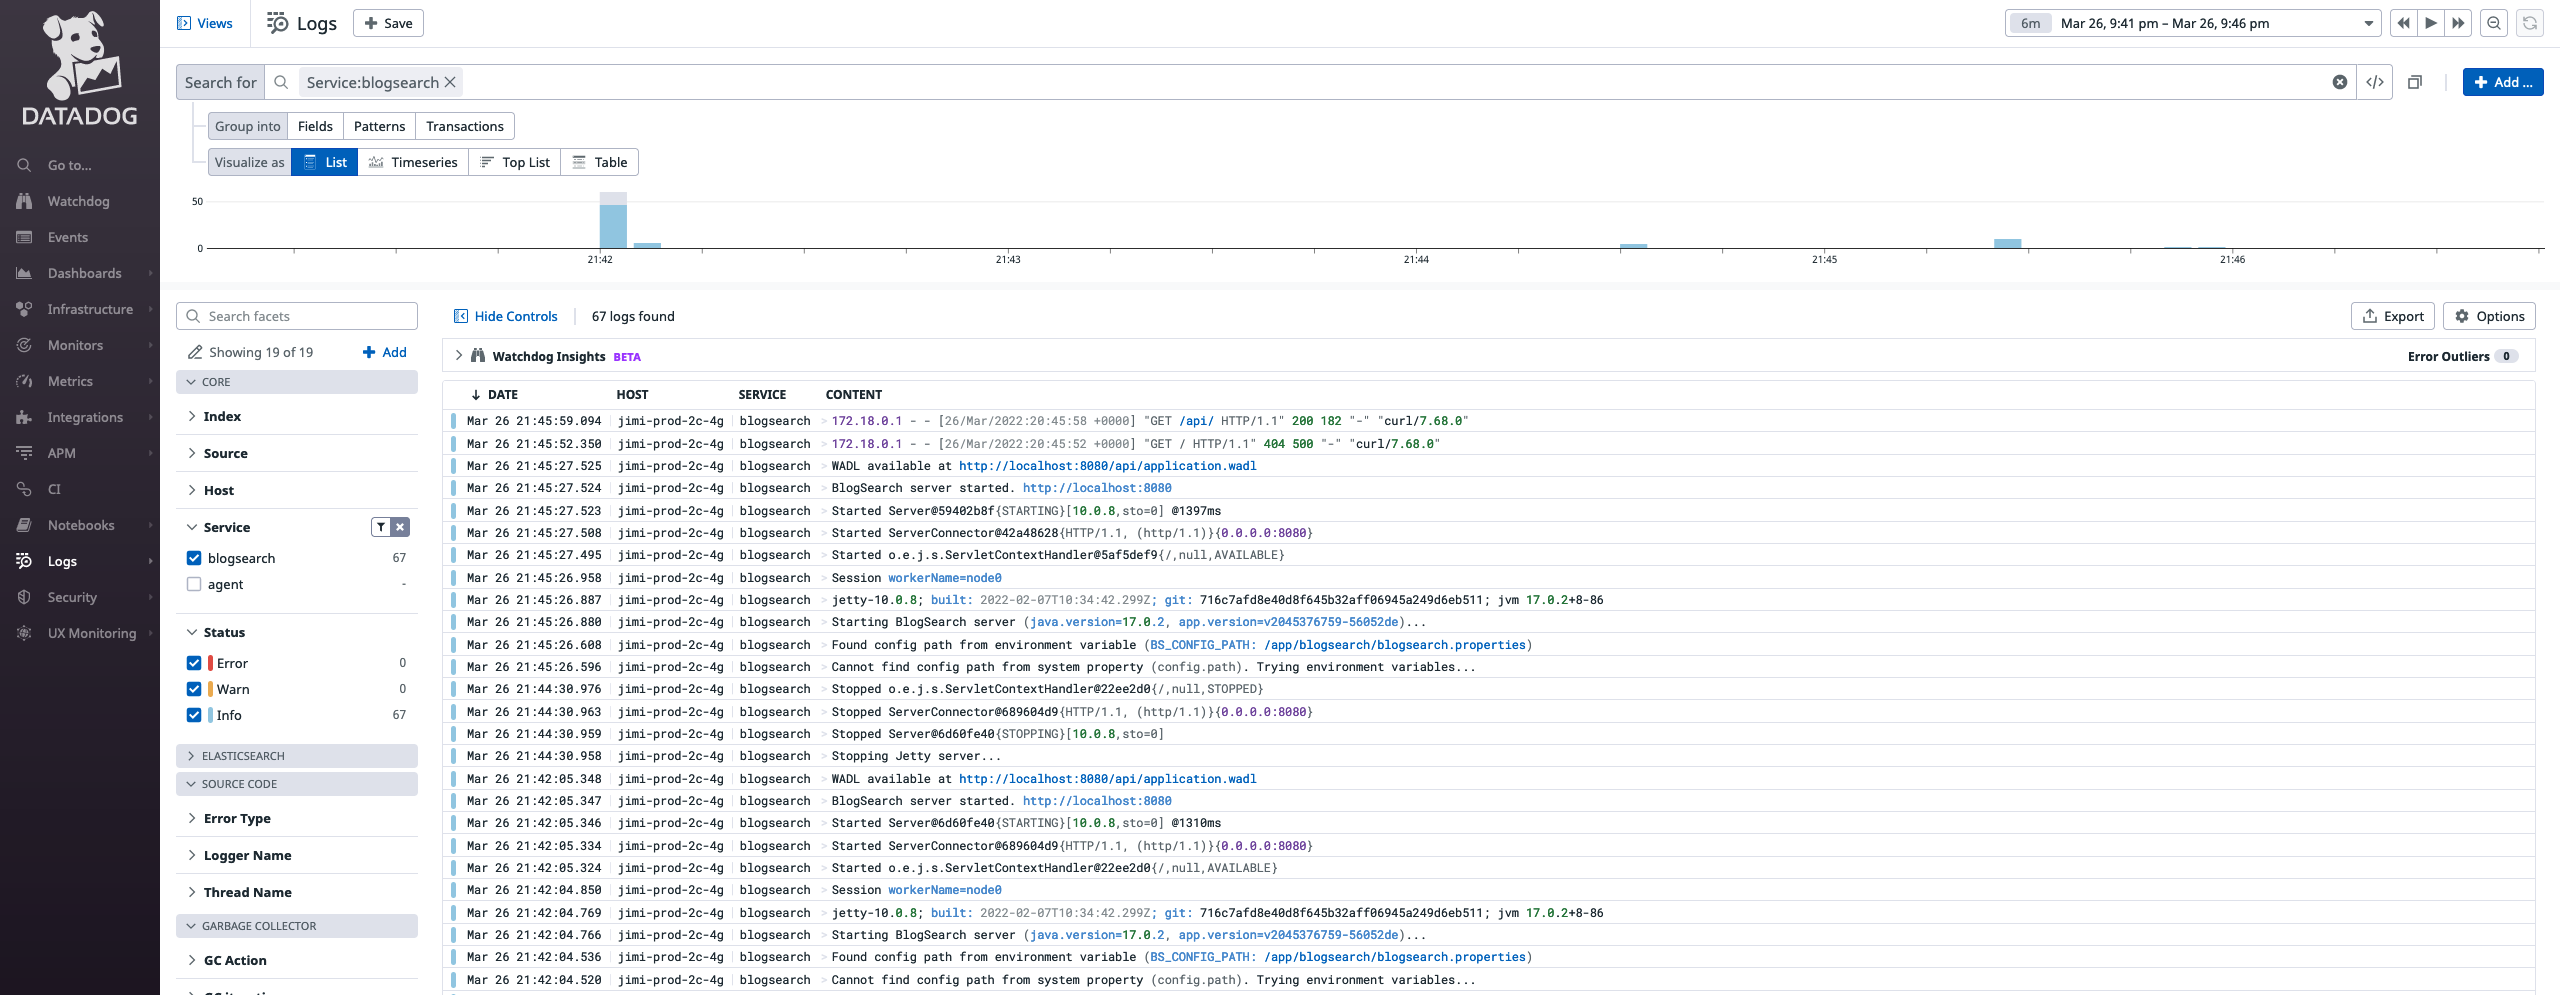
I didn’t completely follow Datadog’s guide because I want to see the logs in both the file and the console. Then, when starting the Java Docker container, I also added some labels for autodiscovery:
docker run \
    --detach \
    --label com.datadoghq.ad.logs='[
        {
          "type": "java",
          "source": "java",
          "service": "blogsearch",
          "sourcecategory": "java",
          "path": "/path/to/app.log"
        }
      ]' \
    --name blogsearch \
    --publish 8080:8080 \
    --network network-blogsearch \
    ...
    "${REPO}:${TAG}"
and we can see that the logs are collected successfully:
APM
Then I want to go one step further: I want to enable the Application Performance Management (APM) as well. Because it gives teams the insight they need to identify areas in need of optimization and prioritize tasks effectively. Datadog has a page for Getting Started With Tracing, there is also custom quick start instructions within the Datadog website for the best experience. Below, I am using the Datadog-website version to enable APM step by step, where I can choose the environment, host configuration, language, and Datadog will generate commands for me.
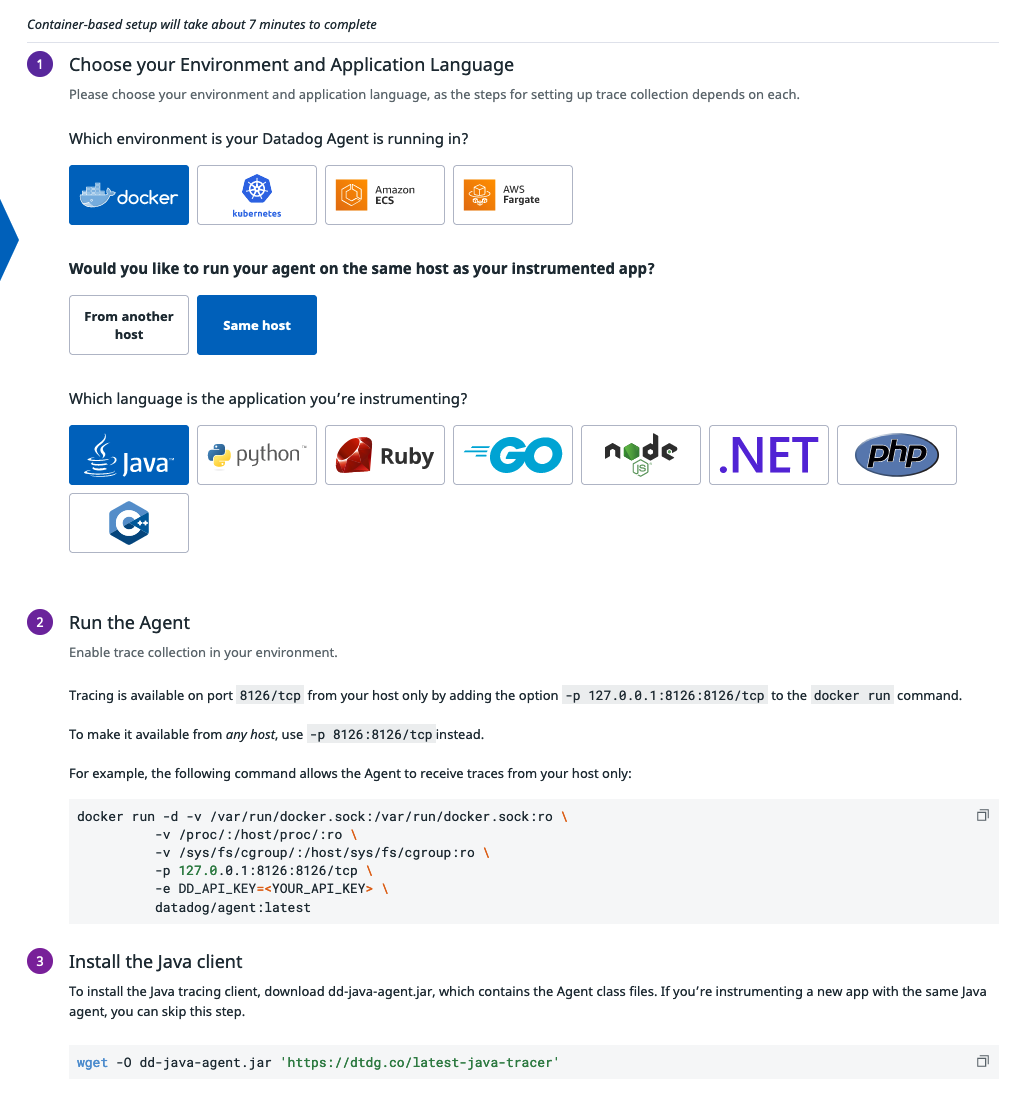
Most of the things went smoothly. The only problem for me was that I chose the wrong option in the “same host” part and I didn’t receive any traces in Datadog Agent. I should have chosen “From another host” as different containers (Java app, Datadog agent) were running in different containers. Concretely, it means that we need to configure the applications and Datadog agent a bit differently:
- For the
blogsearchJava application, I need to specify the host of the Datadog agent via the environment variable-e DD_AGENT_HOST=datadog-agentso that the tracer knows to which host it needs to send the data. - For the Datadog agent, I need to enable non-local traffic via the environment
variable
-e DD_APM_NON_LOCAL_TRAFFIC=trueand add it to the Docker network of the Java application via the option--network network-blogsearch.
On the Datadog agent side, the start-command looks like this:
docker run -d --name datadog-agent \
           --network network-blogsearch \
           -e DD_API_KEY=$DD_API_KEY \
           -e DD_APM_NON_LOCAL_TRAFFIC=true \
           -e DD_LOGS_ENABLED=true \
           -e DD_LOGS_CONFIG_CONTAINER_COLLECT_ALL=true \
           -e DD_SITE="datadoghq.eu"  \
           -p 127.0.0.1:8126:8126/tcp \
           -v /run/user/1000/docker.sock:/var/run/docker.sock:ro \
           -v /proc/:/host/proc/:ro \
           -v /opt/datadog-agent/run:/opt/datadog-agent/run:rw \
           -v /sys/fs/cgroup/:/host/sys/fs/cgroup:ro \
           datadog/agent:7
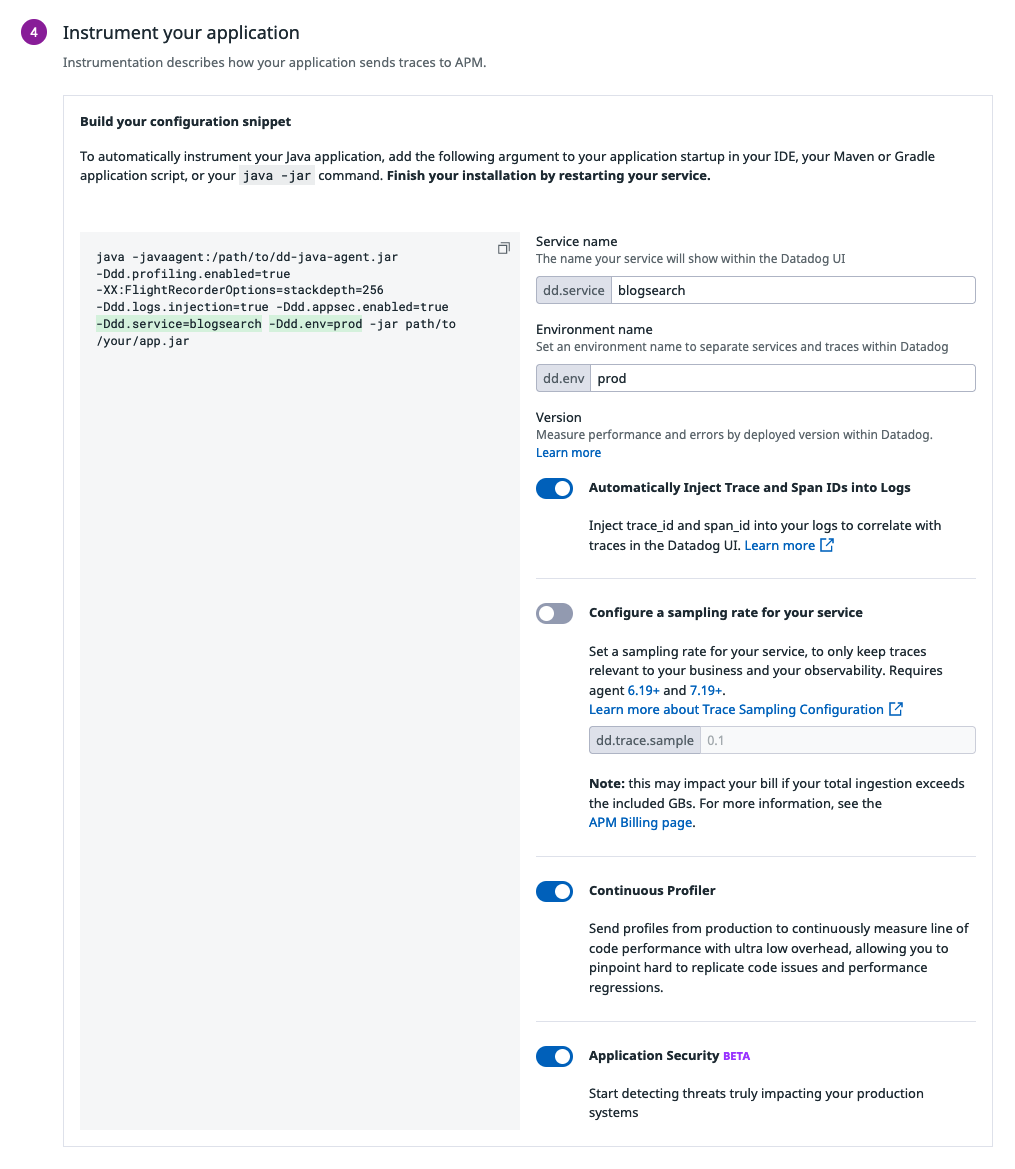
On the application side, I need to:
- Download the tracer JAR in the
Dockerfile - Include it as the Java agent of the Java application and specify the Java
property
dd.service - Specify the
DD_AGENT_HOSTin the Docker start-command
Once these are done. I also added the tracer in Elasticsearch, it mainly means:
- Create a custom Dockerfile for Elasticsearch.
- Download the tracer JAR and use it as Java agent for Elasticsearch. This can
be done via the
ES_JAVA_OPS, the same as the Java application mentioned above. Also, specify the Javadd.service - Grant additional permissions for this JAR using an additional security policy file as Elasticsearch has a security manager which contains strict and fine-tuned security permissions for the classpath, network, filesystem, system properties, etc.
- Publish Docker image to my personal Docker registry.
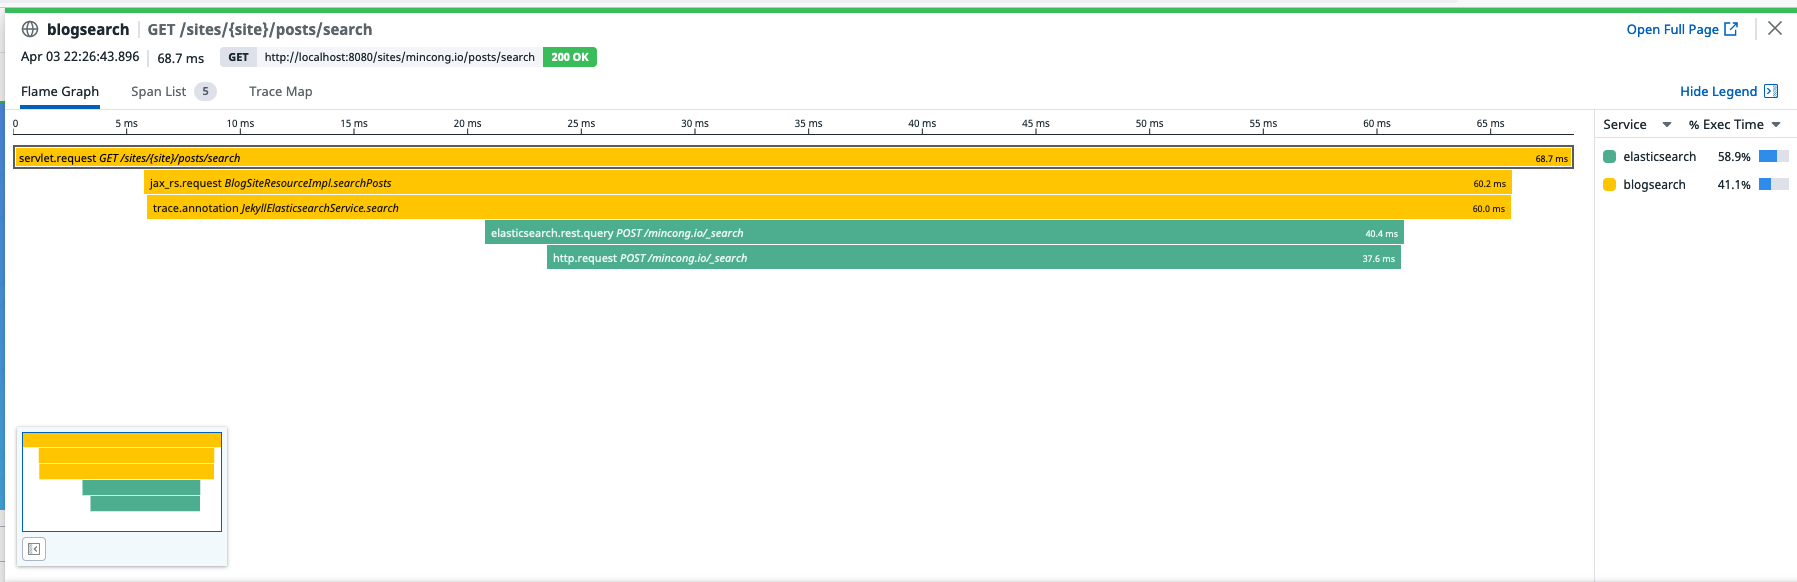
After all these efforts, we can see the traces in Datadog’s website:
Profiling
For Java applications, the profiling can be done via Continuous Profiler. The profiler is already included inside the Java tracer, so we just need to enable it:
java -javaagent:/path/to/dd-java-agent.jar \
  -Ddd.profiling.enabled=true \
  -XX:FlightRecorderOptions=stackdepth=256 \
  ...
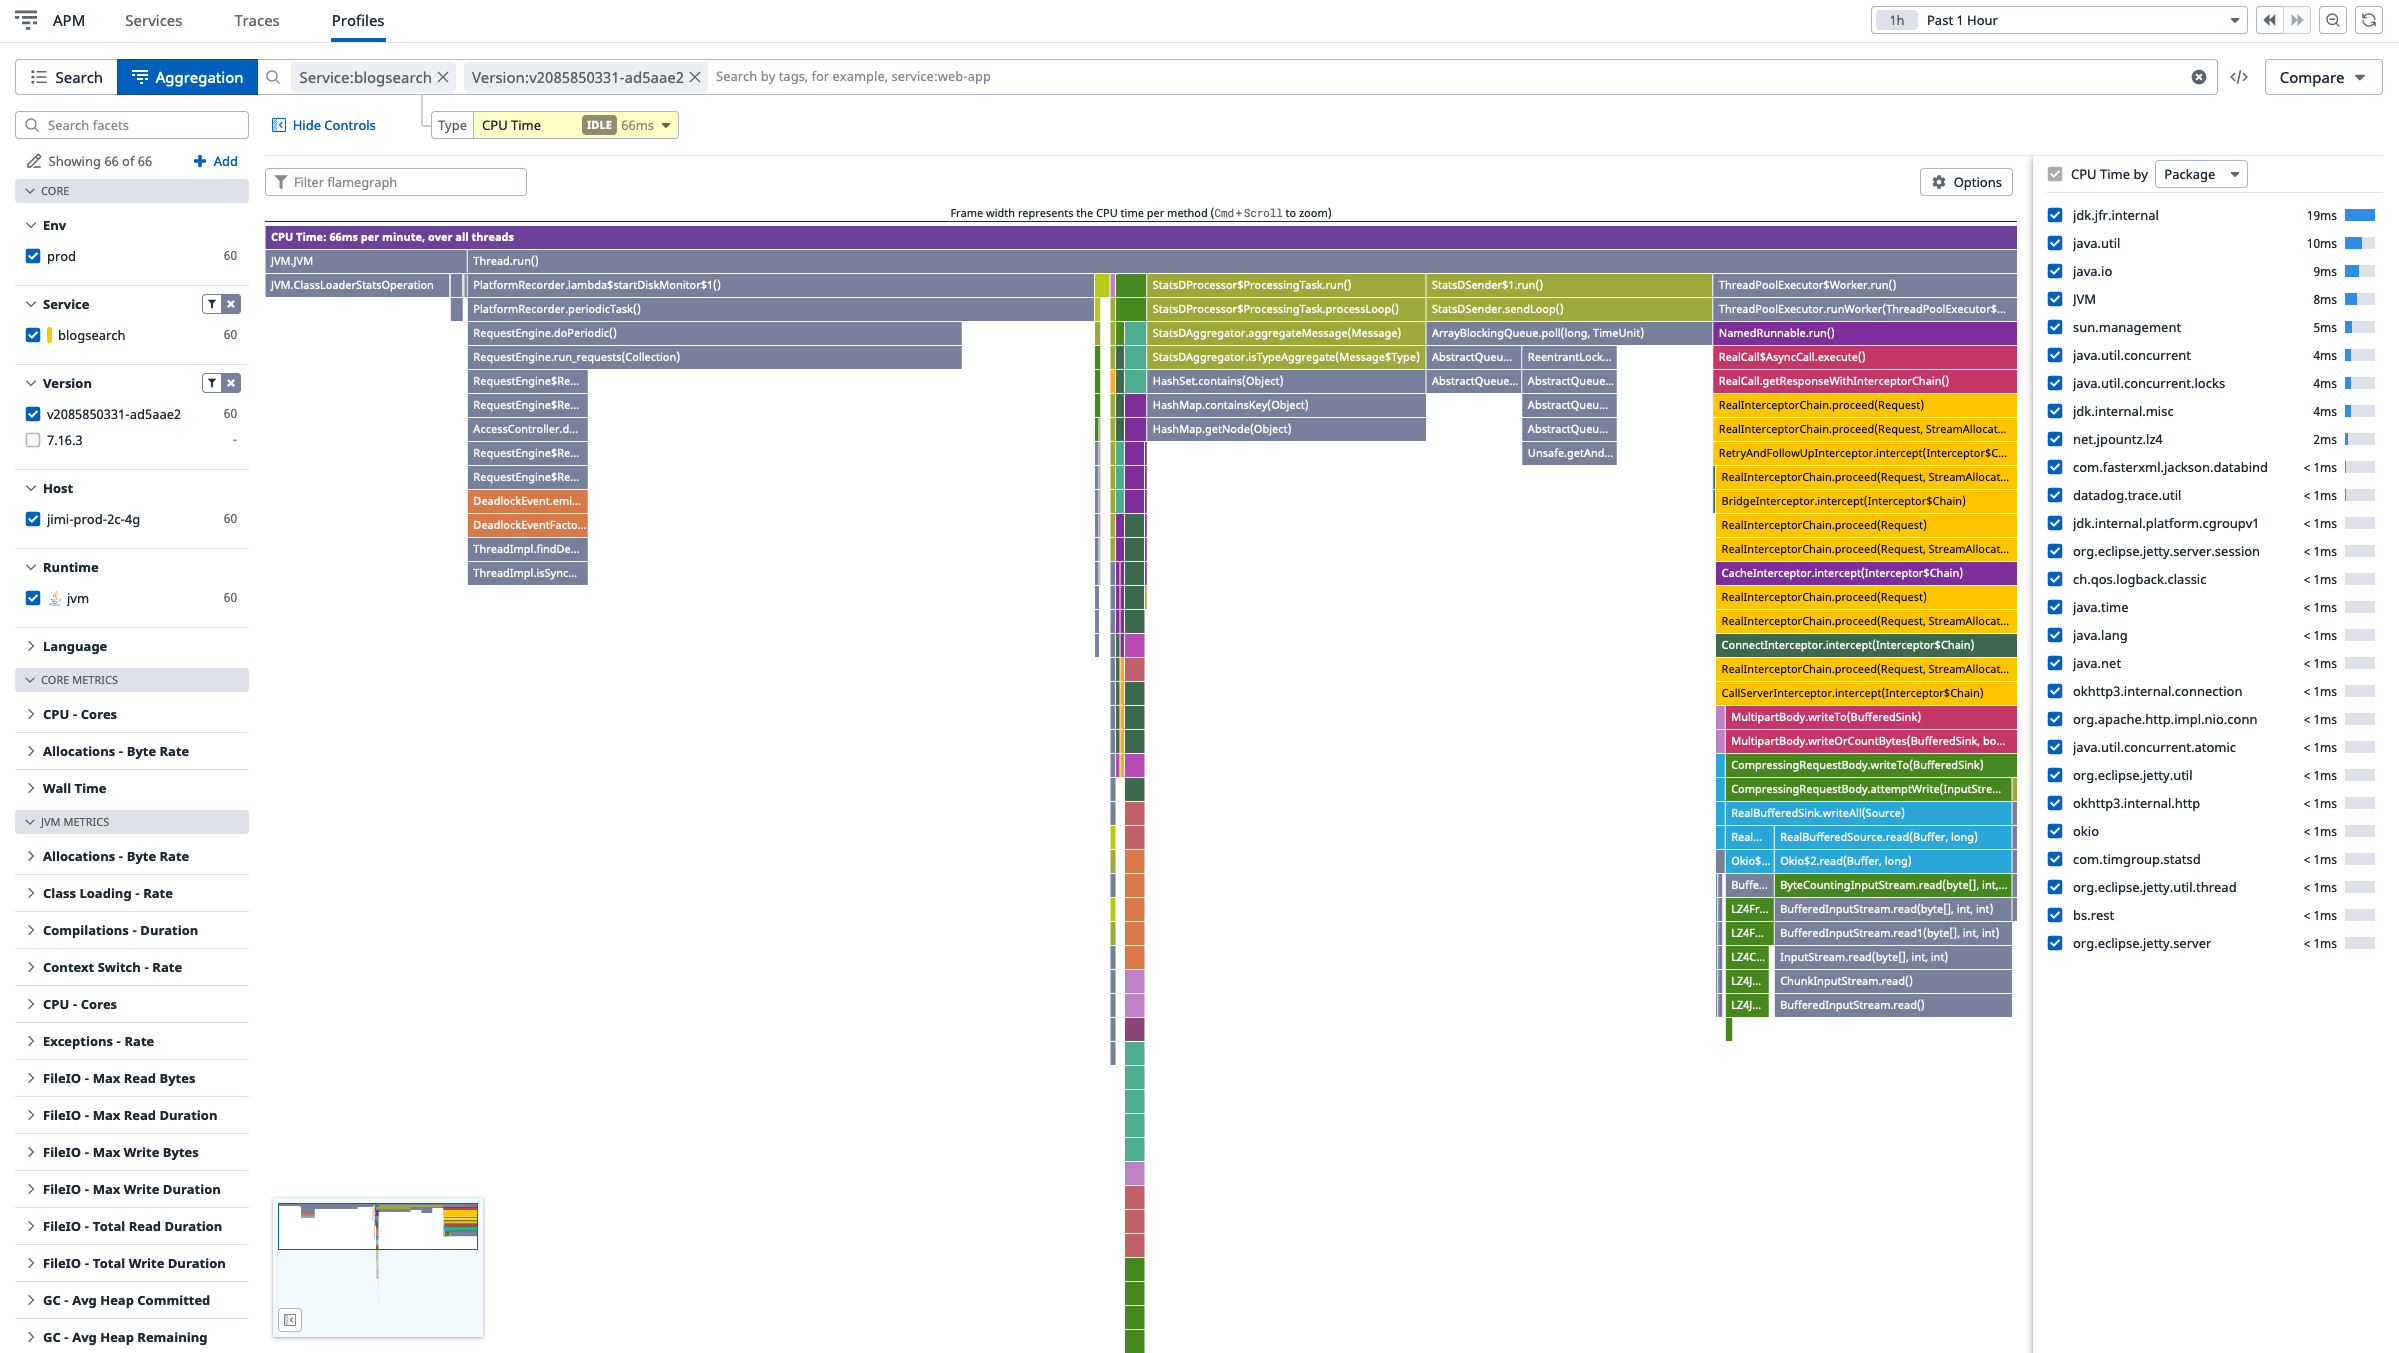
Once it is enabled, we can see the profiling data on Datadog’s website:
By the way, if you have a security manager enabled, you will probably need to grant more permissions to the tracer JAR:
grant {
    permission jdk.jfr.FlightRecorderPermission "accessFlightRecorder";
    permission jdk.jfr.FlightRecorderPermission "registerEvent";
    // ...
}
Pricing
How much will it cost for a normal customer?
I am lucky enough to be a Datadog employee so that the data above is free, but I want to know what will it cost for normal customers. Out of curiosity, I decided to following the pricing and do an estimation.
| Item | Unit Price | Price | Description |
|---|---|---|---|
| Infrastructure | $15/host/month | $15/month | “Pro” plan for one host, with 15 months full-resolution data retention and unlimited alert. |
| Logs management (ingestion) | $0.10/GB/month | $0.1/month | I don’t have much logs right now. 1GB should be enough. |
| Logs management (storage) | $1.70/million/month | $1.8/month | - |
| APM and Continous Profiler | $40/host/month | $40/month | Billed annually. |
| Total | - | $56.8/month |
Conclusion
In this article, we saw how to collect metrics and logs from the cloud provider (Alibaba Cloud), from Elasticsearch, and from Java application through autodiscovery using Datadog agent. We also saw how to enable APM and profiling. Interested to know more? You can subscribe to the feed of my blog, follow me on Twitter or GitHub. Hope you enjoy this article, see you the next time!
References
- Datadog Docs, 2022.